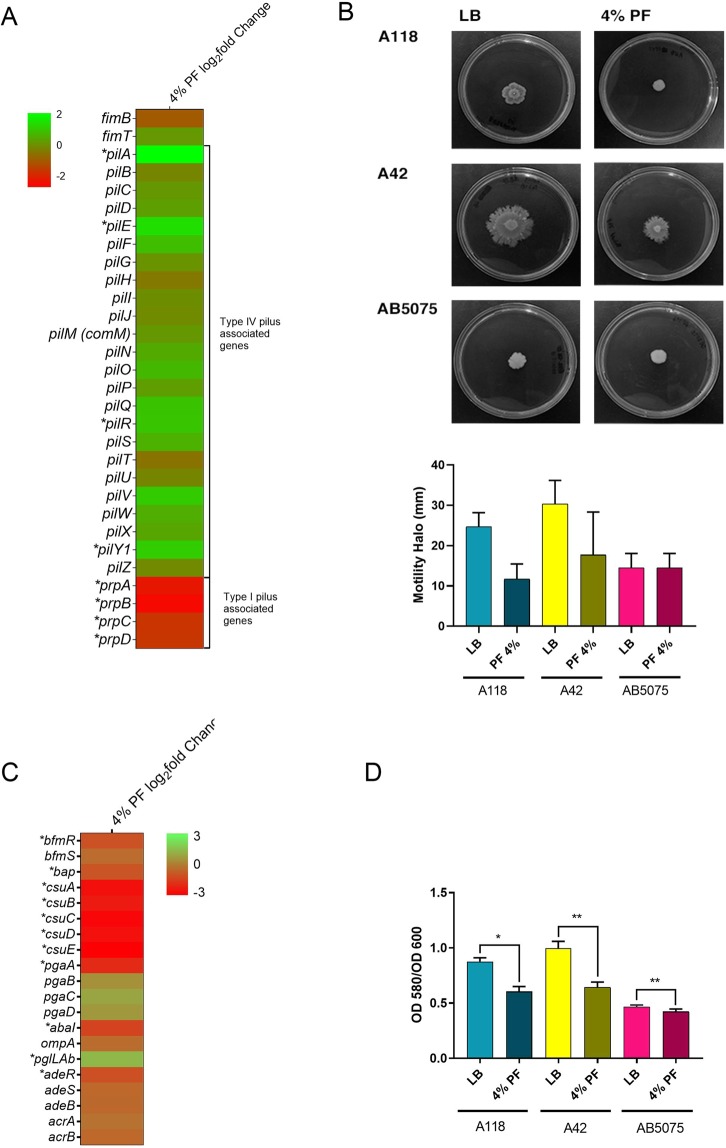
Figure 2.
Phenotypic and genetic analysis of surface associated motility genes and biofilm formation. (A) Heatmap outlining the differential expression of genes associated with fimbriae biogenesis, structural organization of T4P and motility, and type I pilus. The majority of motility associated genes are up-regulated (green) in the presence of PF. The asterisks represent the DEGs (adjusted P-value < 0.05 with log2fold change > 1). (B) Surface motility assays resulted in a decrease in the diameter of motility (mm) when grown in the presence of PF. Experiments were performed in triplicate, with at least three technical replicates per biological replicate. Statistical analysis (Mann-Whitney test) was performed using GraphPad Prism (GraphPad software, San Diego, CA, USA), and a P-value < 0.05 was considered significant. (C) A heatmap of the differential expression of genes associated with biofilm formation, including ompA, the csu operon and its regulator bfmRS. Asterisks represent the DEGs (adjusted P-value <0.05 with log2fold change >1). (D) Biofilm assays performed with and without PF show a significant decrease in biofilm formation as represented by OD580/OD600, when grown in the presence of PF. Experiments were performed in triplicate, with at least three technical replicates per biological replicate. Statistical analysis (Mann-Whitney test) was performed using GraphPad Prism (GraphPad software, San Diego, CA, USA), and a P-value < 0.05 was considered significant.

