Figure 2.
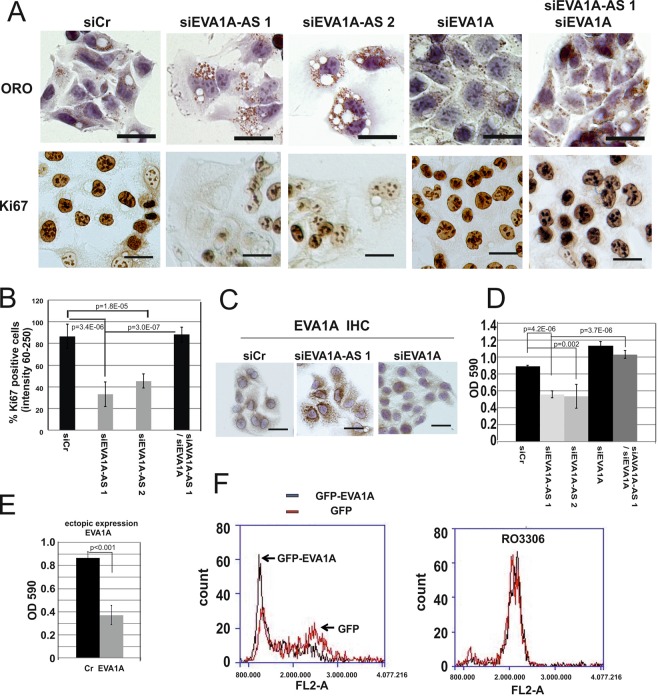
Depletion of EVA1A-AS in HepG2 cells induced lipid droplet accumulation and stopped cell cycle. (A) HepG2 cells were chemically fixed 3 days after transfection with siCr, siEVA1A-AS 1, siEVA1A-AS 2 and/or siEVA1A and then applied for oil red O (ORO) or Ki67 specific immunohistochemical staining. Bars represent 40 µm. Three independent experiments were performed and representative images are shown. (B) To quantitate the intensity of Ki67 staining, reciprocal pixel intensity was determined by subtracting the Ki67 intensity from the maximum pixel intensity in white unstained areas (as measured by the mean intensity function in the Nikon NIS elements D 3.0 Software). The mean percentage of dark staining (positive: reciprocal intensity 60–250) nuclei is shown. Bars represent +/−SD. At least 200 cells from 3 images were quantitated per experiment. p value: t-test. (C) Endogenous EVA1A was immunohistochemically stained in HepG2 cells after transfection with siCr, siEVA1A-AS, or siEVA1A. Bars represent 40 µm. (D) Sister culture of (A) was stained with crystal violet and measured density by OD590. (E) EVA1A was ectopically expressed in HepG2 cells and three days after transfection cells were fixed and stained with crystal violet. (F) HepG2 cells were transfected with GFP or GFP-EVA1A in the presence or absence of CDK1 inhibitor, RO3306. Fixed cells were stained with propidium iodide (PI) and analysed by Accuri-C6 flow cytometer (BD Biosciences) under standard settings for detecting PI (FL-2) using a 488 nm laser.

