Figure 5.
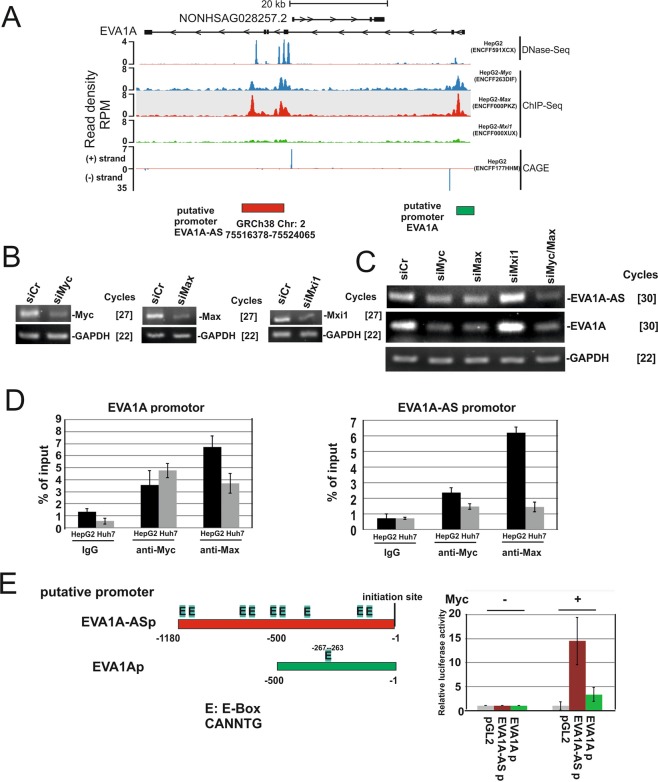
Both EVA1A and EVA1A-AS were regulated by Myc/Max. (A) DNase-sequencing (DNase-seq) datasets from HepG2 (ENCFF591XCX), ChIP-seq datasets HepG2 Myc (ENCFF263DIF), HepG2 Max (ENCFF000PKZ), and HepG2 Mxi1 (ENCFF000XUX), and cap analysis of gene expression (CAGE) data in HepG2 cells (ENCFF177HHM) generated by the ENCODE Consortium were aligned to the reference human genome (GRCh38). SeqMonk was used to quantitate and visualize the data. Yellow box: putative EVA1A-AS promoter; green box: putative EVA1A promoter. (B,C) siCr, siMyc, siMax, or siMxi1, were transfected in HepG2 cells and RNA was applied for Myc, Max, Mxi1, EVA1A-AS, EVA1A or GAPDH specific semi quantitative qRT-PCR as indicated. []: number of PCR cycles. Three independent experiments were performed and representative images are shown. (D) After cross-linking by adding formaldehyde, protein and DNA were extracted from HepG2 or Huh7 cells and the chromatin was sheared by sonication. Cell extracts and immunoprecipitates using Myc or Max antibodies or control IgG were analyzed by EVA1A (promoter region, −124 to −299) and EVA1A-AS (promoter region,−42 to −235) specific PCR (Table 1; ChIP). Numbers represent nucleotide numbers from the initiation site for each gene. Data represent percent (%) input of each PCR reaction. Three independent experiments were performed. (E) location of E-Box (E: CANNTG) in the putative promoter regions of EVA1A-AS (EVA1A-ASp) and EVA1A (EVA1Ap). Putative promoter region of EVA1A-AS and EVA1A fused luciferase and luciferase activity was examined in the presence or absence of Myc.

