
Figure 7.
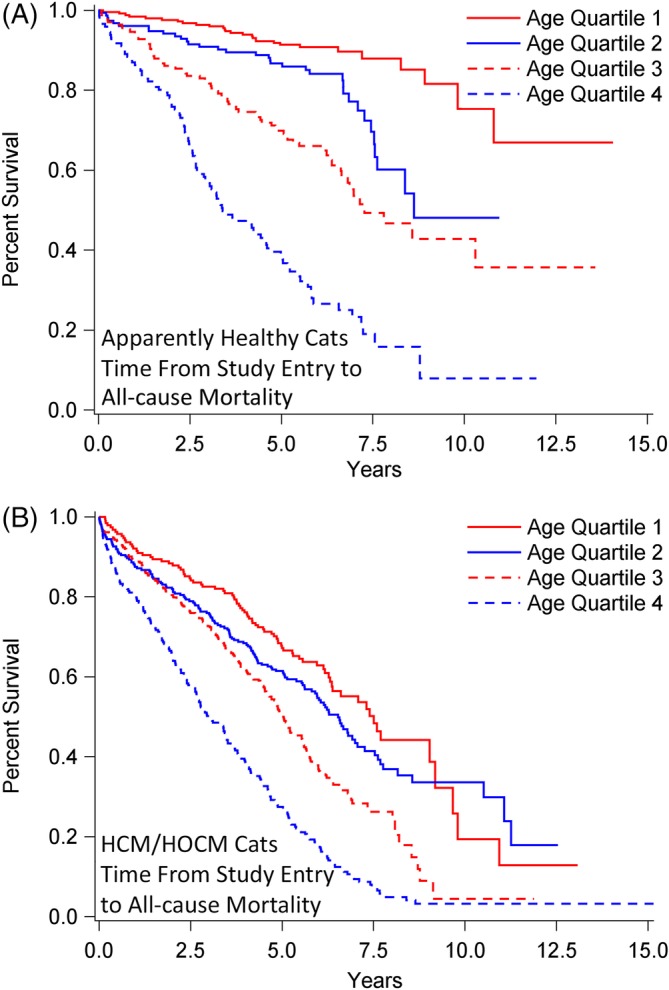
Survival analysis of 1730 cats stratified by age quartile (Q) at study entry when diagnosed as apparently healthy (n = 722; A) or with preclinical HCM/HOCM (n = 1008; B), and that died over time from all‐cause death. Percentage of cats that have not experienced death (y‐axis) is plotted against time from study entry to time to all‐cause death (x‐axis). A, Q1: Median not achieved, range 46 days‐14.1 years; Q2: median 8.6 years, range 15 days‐11.0 years; Q3: median 6.9 years, interquartile range (IQR) 3.3‐13.6 years; Q4: median 3.1 years, IQR 2.0‐5.5 years. Pairwise comparisons between age quartiles were P < .0001, except Q1 versus Q2 (P = .002). B, All median, IQR. Q1: 7.5 years, 4.1‐9.8 years; Q2: 6.5 years, 3.1‐11.1 years; Q3: 5.0 years, 2.7‐8.0 years; Q4: 3.0 years, 1.3‐5.2 years. Pairwise comparisons between age quartiles were P < 0001, except Q1 versus Q2 (P = .10) and Q2 versus Q3 (P = .0003). HCM, nonobstructive hypertrophic cardiomyopathy; HOCM, obstructive hypertrophic cardiomyopathy