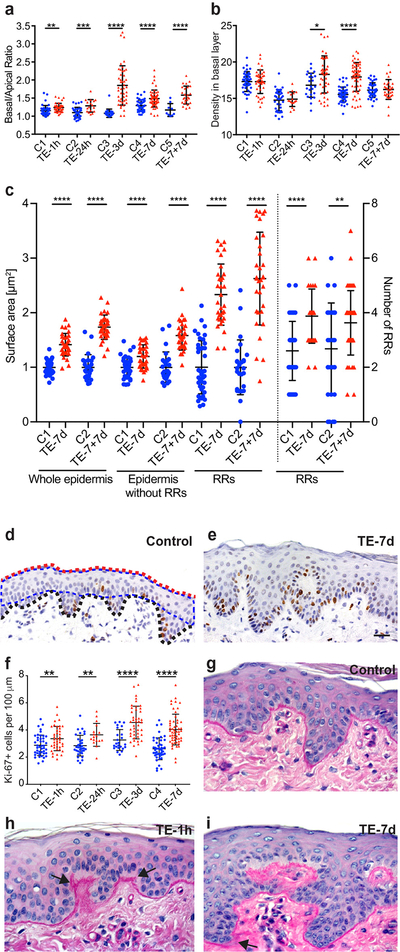
Fig. 2.
Quantification of morphological changes in epidermis under TE. (a) The basal/apical length ratio. (b) Cell density calculated as all nuclei per 100 μm of the basal layer. (c) Comparison of the surface area presented as a mean ± SD and number of RRs between TE-7d and TE-7+7d models. The mean of surface area for C1 was arbitrarily assigned as 1. (d, e) Representative images of IHC for Ki-67 and (f) number of Ki-67 positive cells per 100 μm of the basal layer. The red and black doted lines indicate apical and basal layers, respectively. The blue doted line indicates the surface area without RRs. (g-i) The representative images of PAS staining for BM. The measurements were collected and analyzed using ZEN Blue Zeiss software, and GraphPad Prism. Statistical significance was assessed by unpaired Student t-test *p≤0.05, **p≤0.01, ***p≤0.001, ****p<0.0001; 40x magnification, scale bar = 20 μm. A minimum of three tissue sections for each category and ten images for each section were examined for every model.

