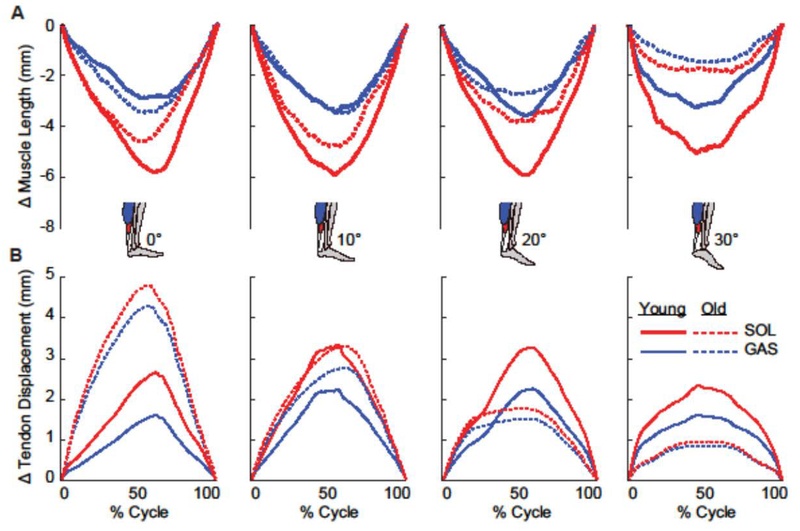
Figure 3:
Group mean (A) muscle shortening and (B) subtendon displacements across the range of ankle angles tested (plantarflexion, positive). Young adult (solid line) and older adult (dashed line) medial gastrocnemius (GAS) muscle and subtendon shown in blue and soleus (SOL) muscle and subtendon shown in red.

