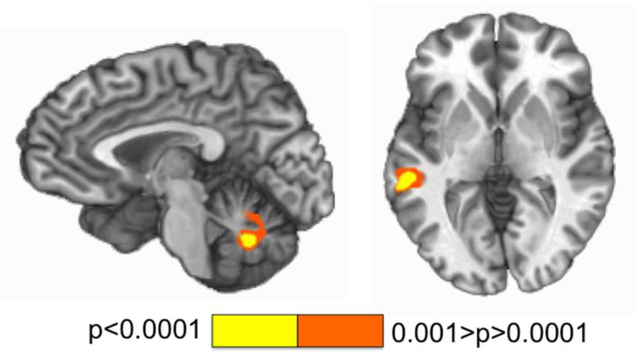
Figure 1.
This figure depicts regions showing differences in activation during incongruent compared to congruent trials during a multisensory Stroop task (bilateral cerebellum, left, talairach x=−4; left temporal gyrus, right, talairach z=2). Activation maps are color-coded according to the magnitude of the voxelwise p threshold for a paired T test comparing incongruent to congruent stimuli.

