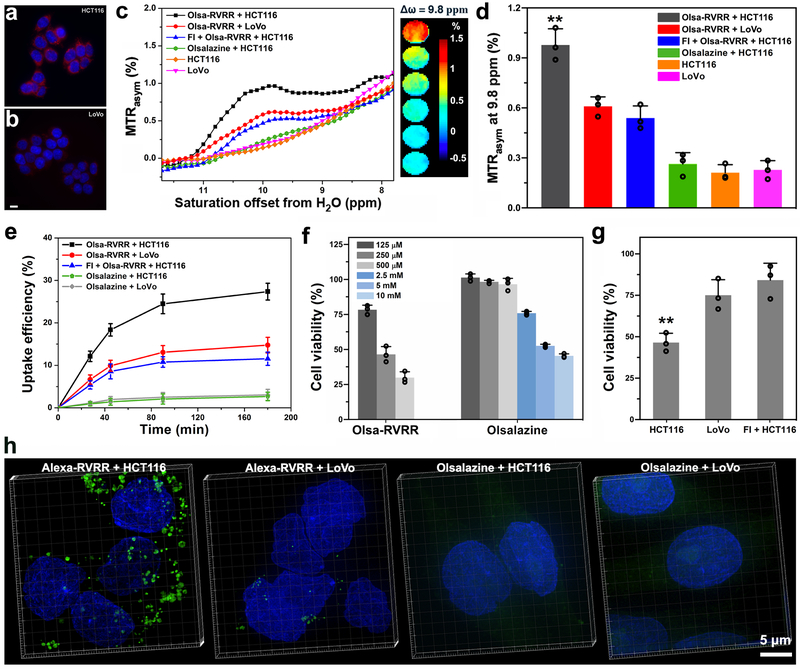
Fig. 3. In vitro cell studies.
(a,b) Validation of furin expression in HCT116 (a) and LoVo cells (b) using anti-furin immunofluorescent staining (red). Nuclei are counterstained with DAPI (blue). Scale bar=10 μm. (c) MTRasym spectra and OlsaCEST signal (from top to bottom) of HCT116 cells + 500 μM Olsa-RVRR, LoVo cells + 500 μM Olsa-RVRR, HCT116 cells + 100 μM FI + 500 μM Olsa-RVRR, HCT116 cells + 500 μM olsalazine, and non-incubated HCT116 and LoVo cells. (d) OlsaCEST signal measured at 9.8 ppm corresponding to Fig. 3c. Data are shown as mean±SD; n=3 independent experiments; one-way ANOVA, followed by Dunnett's post-hoc test; ***P<0.001 vs. all other groups. (e) Time-dependent cellular uptake of the different substrates. Data are shown as mean±SD (n=3 independent experiments). (f) Cell viability of HCT116 cells incubated for 48 h with Olsa-RVRR and olsalazine as a function of substrate concentration. Data are shown as mean±SD (n=3 independent experiments). (g) Cell viability of HCT116 cells, LoVo cells, and FI-pretreated HCT116 cells incubated with 250 μM Olsa-RVRR for 48 h. Data are shown as mean±SD; n=3 independent experiments; two-tailed Student’s t-test; **P<0.01 vs. all other groups. (h) 3D-SIM super-resolution fluorescence images of HCT116 and LoVo cells incubated with 8 μM Alexa-RVRR or 8 μM Alexa 488 for 3 h. Green fluorescence represent furin-mediated, self-assembled Alexa 488 nanoparticles. Cell nuclei were counterstained with DAPI (blue). All subpanels reflect representative data from in vitro experiments repeated three times.

