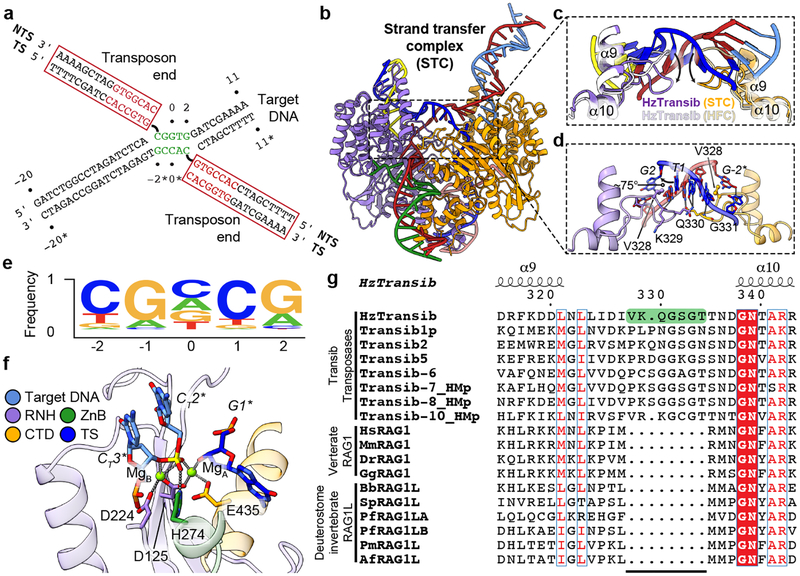
Figure 3. Transposon end integration and strand transfer complex.
a, Schematic of strand transfer product. Heptamer and target site sequences are colored red and green, respectively. b, Overall cryo-EM structure of HzTransib in complex with naturally generated strand transfer product. c, Different conformations of α9-α10 target site binding loop in STC and HFC. d, Interactions between α9-α10 loop and 5 bp target site. Hydrogen bonds are shown as dashed lines. e, Sequence logo representing nucleotide frequencies at HzTransib TIRs integration sites. f, Active site of the TCC model. Mg2+ ions, green spheres. Nucleotide residues in target DNA are indicated with “T” subscript. g, Sequence alignment of Transib transposases, vertebrate RAG1 and deuterostome invertebrate RAG1L proteins. Residue numbers and secondary structure annotation are for HzTransib. The α9-α10 loop in HzTransib is highlighted in green. Species name abbreviations are defined in the legend of Extended Data Fig. 7g.

