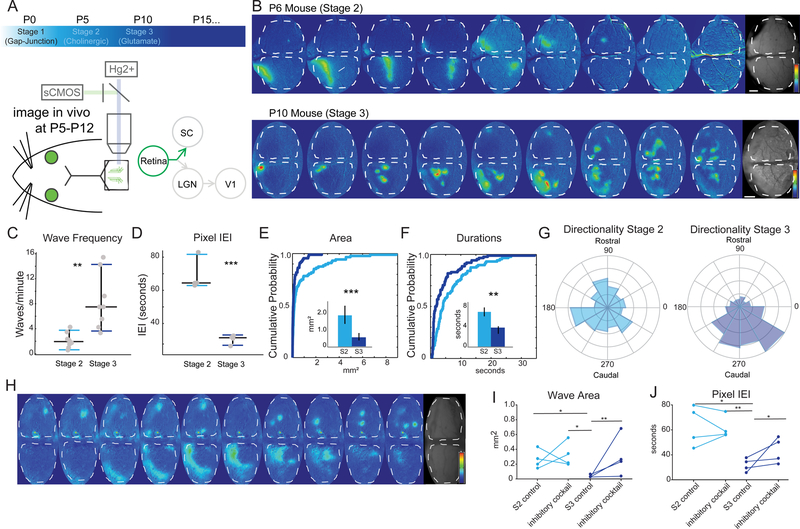
Figure 3: Stage 3 waves are very different than stage 2 waves.
(A) Timeline of retinal waves and experimental set up for wide field imaging of spontaneous activity in the superior colliculus (SC).
(B) Montages of example stage 2 (P6, top) and stage 3 (P10, bottom) waves showing ∆F/F signal, each panel is two seconds apart, 16 seconds total (scale bars=200 µm) and (bottom) time course of activity over 5 minutes.
(C-D) Wave frequency properties of stage 2 and stage 3 waves (C), and inter-event interval (IEI) by pixel (D). Significant differences across a range of measures were apparent between stage 2 and stage 3 waves, n=7 mice for stage 2 and n=8 for stage 3. See also Figures S2 and S3.
(E-F) Cumulative probability distribution (by wave) and means (insets - by hemisphere) of wave activity. Stage 2 waves cover significantly greater area (p = 0.0011, K-S test) and are more long-lasting than stage 3 waves (p = 0.0092, K-S test). Light blue is stage 2, dark blue is stage 3.
(G) Stage 3 waves (right – P10-P12) are more likely to propagate in a rostral-to-caudal direction on the SC than stage 2 waves (left – P5-P8). Circular variance (CV) of all stage 2 waves 0.9354, CV of all stage 3 waves = 0.5110, p=0.0137 for t-test of individual CV.
(H) Montage of the effects of the inhibitory antagonist cocktail (500 mM TPMPA, 50 mM gabazine, and 5 uM strychnine) on stage 3 waves, which resemble stage 2 waves upon application of inhibitory antagonist cocktail to the retina. Saline control in the retina projection to the right hemisphere (top) and inhibitory antagonists in the retina projecting to the left hemisphere (bottom).
(I-J) Summary quantification of the effect of the inhibitory antagonist cocktail on stage 2 and stage 3 waves. Wave area (I) and inter-event (wave) interval (J) are unaltered by application of the inhibitory antagonists during stage 2, but significantly affected during stage 3 (n=4 mice in each group; 4 control saline injected hemispheres and 4 with inhibitory cocktail). The effect of the inhibitory antagonists on stage 3 waves is to increase wave area and inter-event interval, resulting in waves that more closely resemble stage 2. See also Figure S2.
* = p<0.05, ** = p<0.01, *** = p<0.001.

