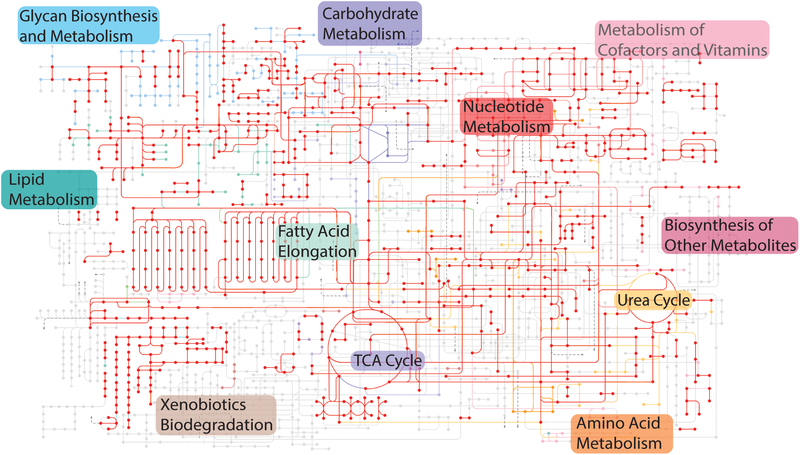
Figure 3: BMAL1 regulation of metabolism.
Overlay of BMAL1 target genes (indicated in red) on diverse metabolic pathways in the liver. BMAL1 occupancy data are from a previously published ChIP-seq dataset (Koike et al., 2012). The original metabolic pathway is from a KEGG analysis (used with permission) and has been simplified to show major nodes (Kanehisa and Goto, 2000, Kanehisa et al., 2017). In KEGG, nodes indicate enzymes and lines indicate connections in metabolic pathways, with colors indicating pathways serving similar functions. The red dots and lines indicate BMAL1 interactions with genes involved in these pathways.

