Figure 3.
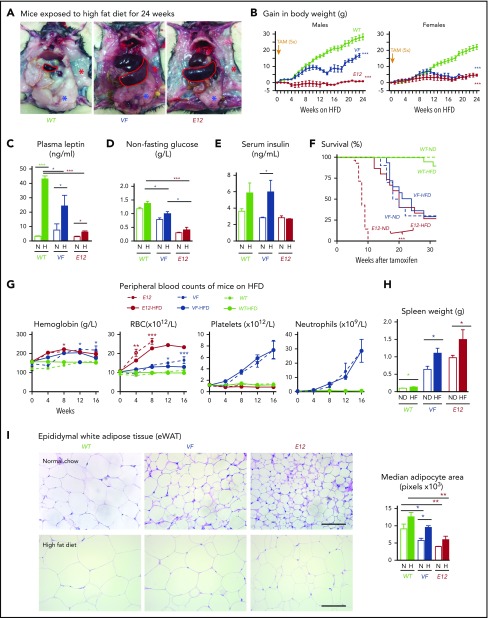
HFD treatment ameliorated early lethality phenotype of PV-exhibiting mutant JAK2–expressing mice. (A) Pictures of male WT and VF- and E12-mutant mice exposed to HFD for 24 weeks. Red and blue asterisks mark reduced subcutaneous and epididymal white adipose tissue (eWAT) fat content, respectively. (B) Time course of body weight gain of HFD-treated mice (n = 8-12 mice per genotype and sex). (C) Plasma leptin concentration in HFD- and normal diet (ND)–treated mice (n = 5 mice per treatment and genotype). (D) Nonfasting blood glucose levels in HFD- and ND-treated mice (n = 5 mice per treatment and genotype). (E) Serum insulin levels in ND- and HFD-treated mice (n = 4-5 mice per treatment and genotype). (F) Survival of mice receiving ND or HFD (n = 12 mice per treatment and genotype). (G) Hemoglobin levels and red blood cell (RBC), platelet, and neutrophil counts in peripheral blood during HFD or ND treatment in indicated mice (n = 6-8 mice per treatment and genotype). (H) Bar graph indicating spleen weight of HFD- and ND-treated mice (n = 5-6 mice per genotype). (I) Representative images of hematoxylin and eosin staining of eWAT from ND- or HFD-treated mice. Scale bars, 100 µm. Bar graph represents the median white adipocyte size of HFD-treated mice (n = 5 mice per). All data are presented as mean ± standard error of the mean. One- or 2-way analyses of variance followed by Tukey’s multiple comparison tests were used for multiple-group comparisons. Significance in survival curves was estimated with the log-rank test. *P ≤ .05, **P ≤ .01, ***P ≤ .001.

