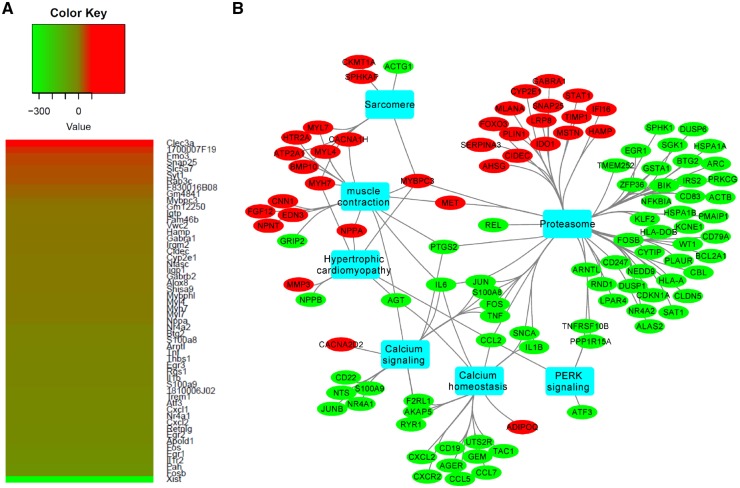
Figure 6.
Differentially regulated genes in cMyBP-CΔC10mut compared with NTG hearts. (A) RNA-seq heat maps depicting clusters of genes differentially regulated in cMyBP-CΔC10mut vs. NTG hearts. Shown is a subset of the most up-regulated (red) and down-regulated (green) genes from the total gene set. The fold change, up or down, is represented in the key for the respective panels (n = 4 pooled samples per genotype). (B) Network of significantly enriched gene ontology terms for upregulated genes in cMyBP-CΔC10mut hearts. The red and green circles denote upregulated and downregulated genes, respectively, in cMyBP-CΔC10mut compared with NTG hearts. Blue rectangles represent significantly enriched (P < 0.05; FDR) biological processes using the ToppFun application of ToppGene Suite.

