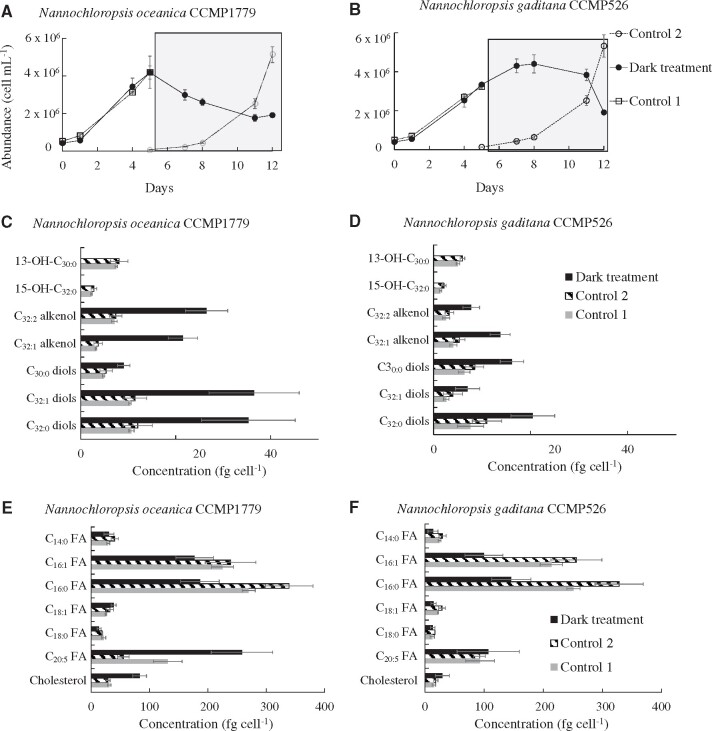
Fig. 1.
Growth curves depicting the cell abundance of N. oceanica CCMP1779 (A) and N. gaditana CCMP526 (B) during the experiments. The shaded areas correspond to the time interval during which the cultures were incubated under dark conditions. Cellular levels of LCAs, LCDs, LCHFAs (C, D), and major fatty acids (E, F) for N. oceanica CCMP1779 (C, E) and N. Gaditana CCMP526 (D, F).

