Fig. 4.
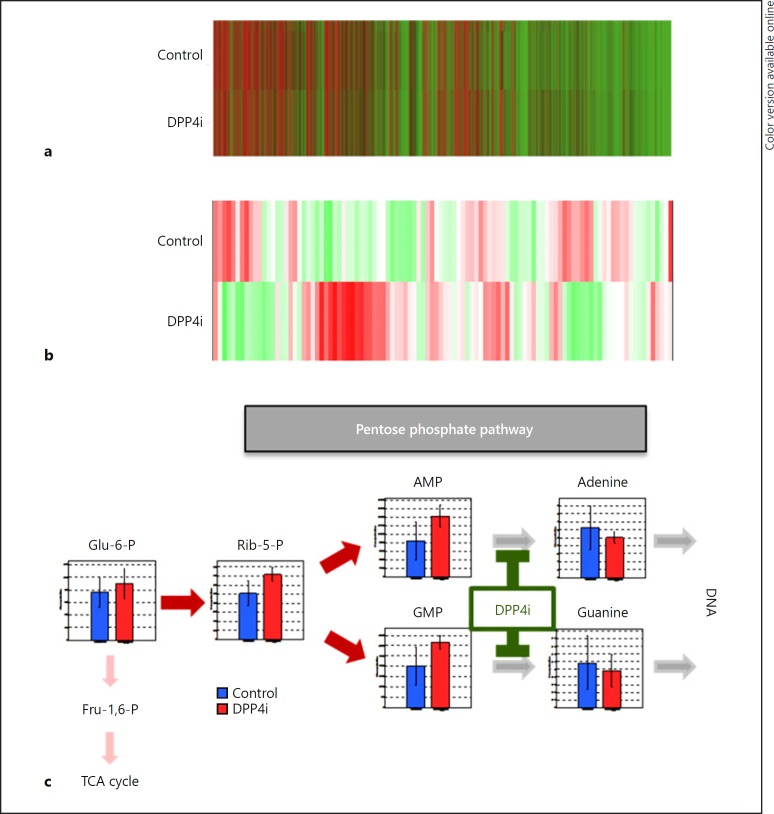
Effect of DPP4i on gene expression and metabolite levels in hepatocellular carcinoma. a Heat map generated from DNA microarray data of the DPP4i group (n = 5) and the control group (n = 5). b Heat map generated from metabolomic analysis data of the DPP4i group (n = 5) and the control group (n = 5). c A scheme of DPP4i-caused changes in the metabolomic pathway. Statistical differences between the DPP4i group and the control group were analyzed by the Wilcoxon rank-sum test. p values of < 0.05 were considered significant. DPP4i, dipeptidyl peptidase-4 inhibitor; Glu, glucose; P, phosphate; Fru, fructose; TCA, tricarboxylic acid cycle; Rib, ribose; AMP, adenosine monophosphate; GMP, guanosine monophosphate; DNA, deoxyribonucleic acid.

