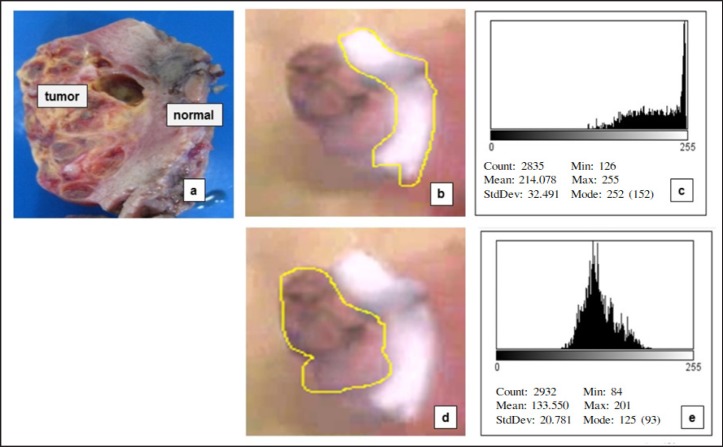
Fig. 3.
Steps for quantifying the fluorescence in the image of the resected specimens. a Appearance of the resected specimen under natural light; b Imaging under near-infrared fluorescence: trace of the normal area; c Histogram of the normal parenchyma; d Imaging under near-infrared fluorescence: trace of the tumor area; e Histogram of the tumor area.

