
Figure 1.
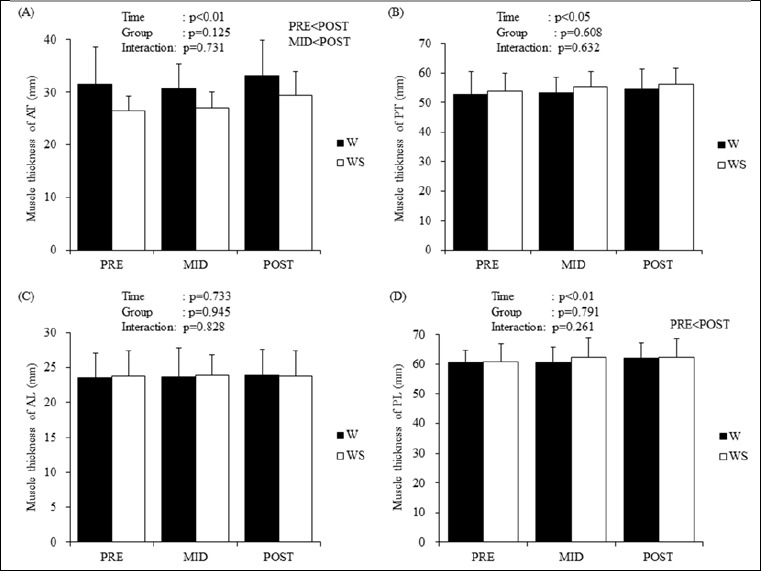
Changes in muscle thickness of the lower limbs in both groups. Data are presented as mean ± standard deviation. (A) AT; anterior aspect of the thigh, (B) PT; posterior aspect of the thigh, (C) AL; anterior aspect of the lower leg, (D) PL; posterior aspect of the lower leg.