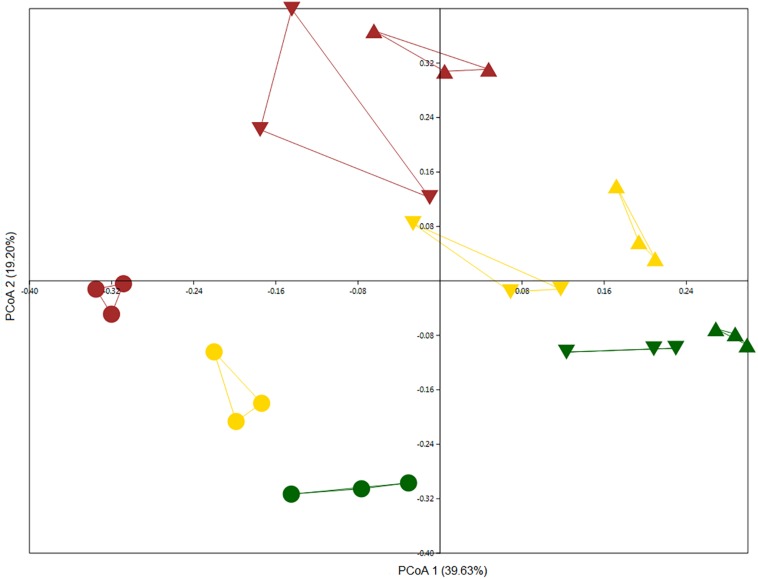
FIGURE 2.
PCoA based on Bray–Curtis distance matrix was performed on culture-independent bulk soil samples collected in 2011 (triangle) and 2013 (inverted triangle) and rhizosphere samples (circle) collected in 2012 showing the structure of bacterial communities from the Highfield experiment under three types of land management: continuous arable (yellow), conversion of bare fallow to arable (brown), and conversion of grassland to arable (green).

