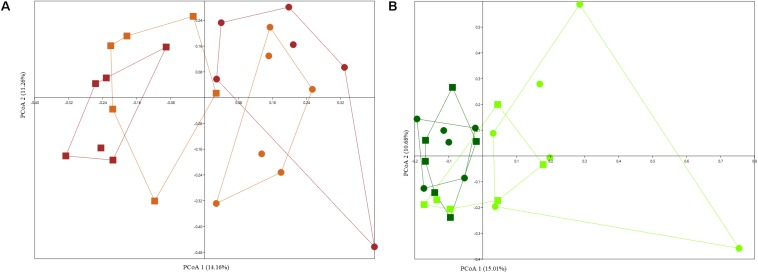
FIGURE 4.
PCoA plots based on Jaccard distance matrix of culturable bacterial communities from the rhizosphere (A) and endosphere (B) of wheat grown in continuous arable or bare fallow soil. The percentage shown on each axis corresponds to the proportion of variation explained. Solid squares represent continuous arable soil and solid circles represent bare fallow soil. Light brown color represents wheat rhizosphere samples derived from the culturing of excised embryos and brown color indicates samples from the rhizosphere of complete seed-derived wheat plants. Dark green color represents samples obtained from the endosphere of complete seed-derived wheat plants and light green color represents samples from endosphere of wheat plants generated from excised embryos.

