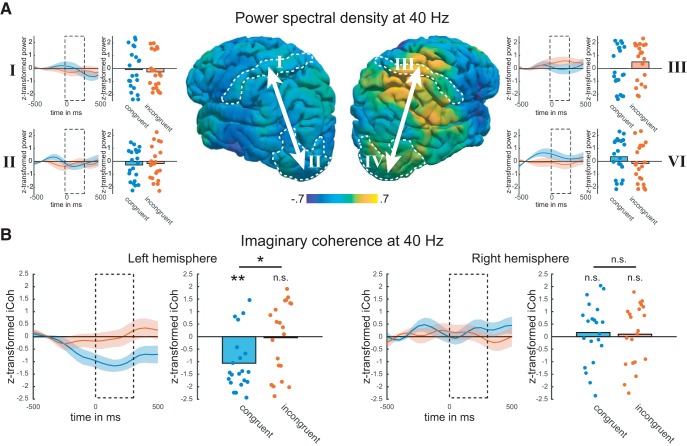
Figure 4.
Results from reanalysis of EEG data. In a previous study (Misselhorn et al., 2019), EEG was recorded during a similar experimental paradigm. Here, we reanalyzed the data with a focus on power and imaginary coherence in and between visual and somatosensory areas at 40 Hz. In the extended data, we present an analysis comparing the average change in 40 Hz power across hemispheres (Extended Data Fig. 4-1) as well as an analysis of the correlation between power and iCoh (Extended Data Fig. 4-2). A, Middle, Distribution of average normalized power at 40 Hz during the change interval. Dotted outlines indicate borders of ROIs. Left, right, Roman numerals indicate the ROI in which power was computed. Each graph depicts the time course of power changes for congruent (blue) and incongruent (red) trials as well as the average power during change (dotted box) as a bar/scatter plot. All comparisons resulted in nonsignificant differences (all p > 0.05). B, Left, Timecourse of iCoh between visual (II) and somatosensory (I) cortices of the left hemisphere. Bar/scatter plots depict average iCoh during change interval (dotted box; n.s. p > 0.05, *p < 0.05, **p < 0.01). Right, Timecourse of iCoh between visual (IV) and somatosensory (III) cortices of the right hemisphere. Bar/scatter plots depict average iCoh during change interval.

