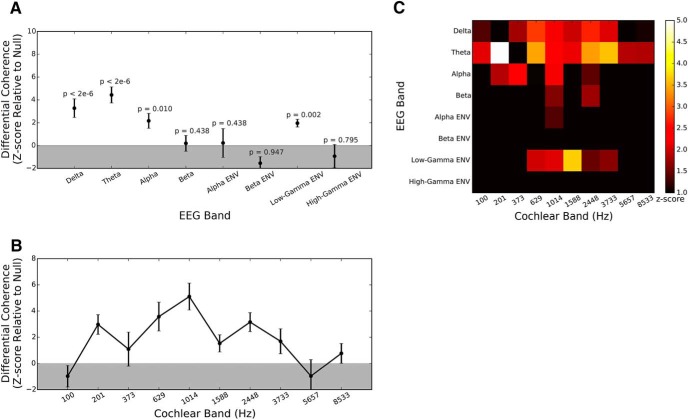
Figure 3.
Differential effects of attention on speech-EEG coherences in different EEG bands (A), different speech bands (B), and the full matrix of EEG bands versus speech bands (C). A, Differential (attended–ignored) coherence averaged across speech bands and EEG channels (shown as a z-score) for each of the EEG bands. Uncorrected p values obtained from the permutation test are displayed for the different EEG bands. When a Bonferroni-corrected p value threshold of 0.05/8 = 0.006 is applied to each band, we find that the delta and theta bands show significantly higher coherence with speech when it is attended compared to when it is ignored. In addition, we also find that the envelope of the low-gamma band shows greater coherence with attended versus ignored speech. B, Differential coherence averaged across all EEG bands and EEG channels (shown as a z-score) for each input speech band. The strongest attention effects appear to occur in the 0.5- to 3-kHz range, which contains spectro-temporal speech features (formants and formant transitions) that convey many vowel and certain consonant cues, and is also the range thought to be the most important for speech intelligibility. In panel C, the differential coherence averaged across EEG channels is shown as a z-score for each EEG band and speech band for completeness. While the 0.5- to 3-kHz speech frequency range shows hot spots in the delta, theta, and low-gamma EEG bands, the lower-frequency speech bands (e.g., 200 Hz) show a hot spot only in the theta range corresponding to the syllabic rate. This could be because the pitch conveyed by the resolved harmonics of the syllabic voicing may be an important cue based on which attention is directed. In all three panels, z-scores shown are averaged across speech stories and individual subjects, with error bars representing the SE.

