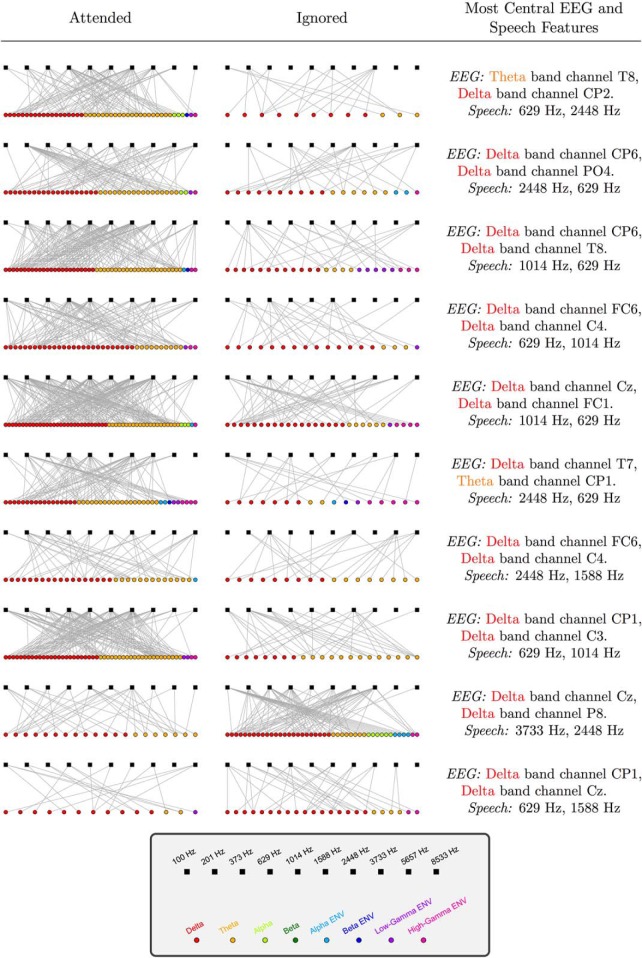
Figure 5.
Graph representation of speech-EEG coherence in the attended and ignored conditions for all individual subjects. Rows represent different individuals. Squares denote speech features (i.e., the envelopes from the ten speech bands; shown in the order of increasing center frequency). Each circle denotes an EEG feature (i.e., a particular EEG band from a particular scalp location). An edge between a speech and EEG feature indicates that the coherence between them meets a threshold of 3 SDs from the mean. Only EEG features with one or more edges that survive the thresholding procedure are shown. Attended graphs exhibit greater number of edges compared to ignored graphs for all but two subjects (see bottom two rows). Additionally, the graph structure is variable across subjects. The top two EEG and speech features that are most informative (as obtained using eigenvector centrality) about an individual’s attentional focus also vary across subjects (rightmost column).

