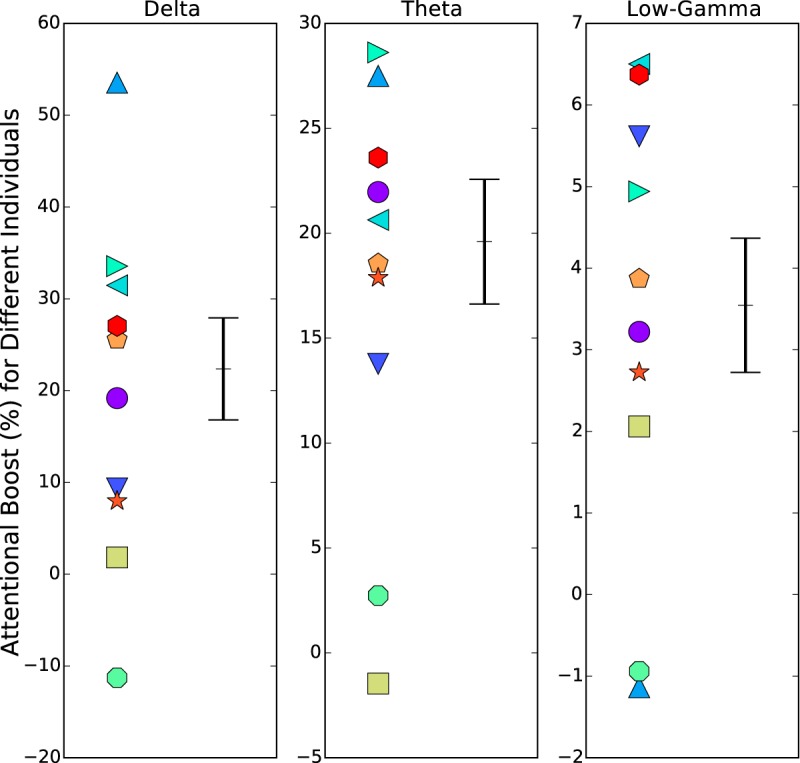
Figure 6.

Individual differences in the overall magnitude of attentional enhancement of speech-EEG coherences in different EEG bands. Each individual’s attentional boost in coherence is shown (with an individual-specific marker symbol and color) for the delta, theta, and low-gamma EEG bands (i.e., the bands showing significant attention effects in Fig. 3A). The mean and SE across individuals are also indicated in black. Note that the y-axis ranges differ between the three panels of the figure. The attentional boost was computed as the percentage change in squared coherence going from the ignored condition to the attended, averaged across EEG channels, speech bands, and the different speech stories. The distribution of the attentional boost across individuals is skewed above zero in all three EEG bands, consistent with positive attentional boost in the neural coding of target speech. Furthermore, there is considerable variation across subjects almost uniformly over the range of boosts.
