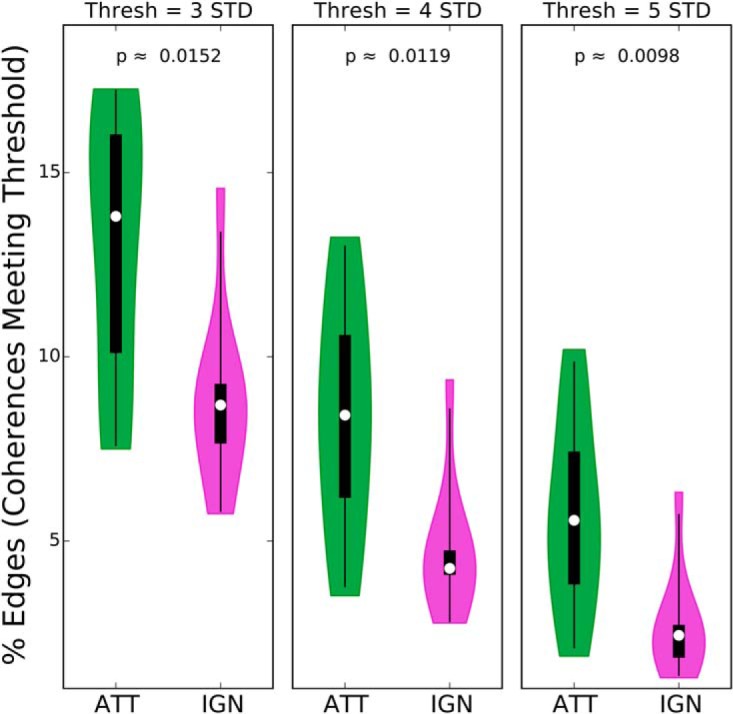
Figure 7.

Percentage of edges (i.e., coherences meeting threshold) in attended (ATT) and ignored (IGN) speech-EEG bipartite graphs, at different coherence thresholds. The across-subject distribution of the percentage of graph edges is shown as a violin plot, separately for the attended and ignored conditions, and for three different coherence thresholds. In addition, the median (white dot), 50% confidence limits (thick black box), and 95% confidence limits (black whiskers) of each distribution are shown. Across all three threshold values, the number of edges is significantly larger for the attended condition (based on a permutation test; p values are shown). While Figure 3 showed that specific speech-EEG associations are strengthened by attention, the present result suggests that a greater number of distinct speech-EEG associations are induced by attention.
