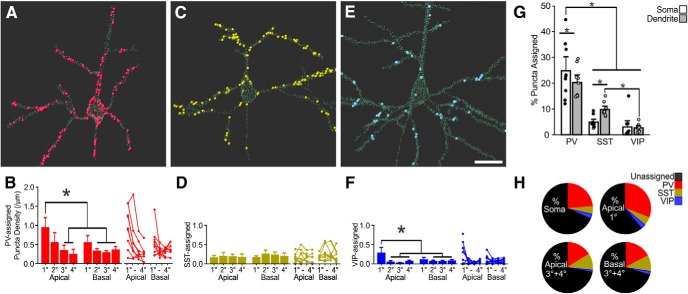
Figure 7.
The distribution of PV, SST, and VIP inputs across L2/3 Pyr neurons. A, PV-input assigned synapses for an example L2/3 Pyr neuron. Small light-green spheres are un-assigned FAPpost puncta; large colored spheres are input-assigned FAPpost puncta. See Extended Data Figure 7-1 for images of all input-analyzed Pyr neurons. B, Mean density of PV-assigned FAPpost contacts across dendritic branch orders. Left, Bar is mean ± SEM of all cells. Right, Individual cell values, plotted as connected lines. All data shown, statistical comparisons performed on balanced data. PV-assigned puncta density was greater for the 1° apical dendrite. RM ANOVAPV-Input: F(7,28) = 6.7, p = 0.002; n = 5 cells, N = 3 animals. *, Tukey post hoc pairwise comparison test, p < 0.05. C, As in A, but for SST. See Extended Data Figure 7-2 for images of all input-analyzed Pyr neurons. D, SST-assigned puncta density was not statistically significantly different across branch orders. RM ANOVASST-Input: F(7,28) = 0.63, p = 0.7; n = 5 cells, N = 3 animals. E, As in A, but for VIP. Scale bar = 20 μm. See Extended Data Figure 7-3 for images of all input-analyzed Pyr neurons. F, VIP-assigned puncta density was greater for the 1° apical dendrite. RM ANOVAVIP-Input: F(7,42) = 3.8, p = 0.003; n = 7 cells, N = 3 animals. *, Tukey post hoc pairwise comparison test, p < 0.05. G, Inhibitory innervation of Pyr neurons, expressed as a percentage of the total number of detected synapses, for each input source. All dendritic compartments pooled for somatic and dendritic comparison. Two-way RM ANOVAInput: F(2,24) = 45, p < 0.001. All * show Tukey post hoc pairwise comparison test, p < 0.05. H, Pie-chart showing average proportion of input-assigned FAPpost contacts versus total detected synapses, binned as perisomatic (soma and 1° apical) or higher-order dendritic compartments (apical 3° + 4° and basal 3° + 4°). A greater proportion of PV-inputs were found on soma and 1° apical dendrite than for SST- or VIP-inputs. At higher-order apical branches, the proportion of SST-input (10.5 ± 1.9%) was similar to PV-input (16.2 ± 1.9%), but significantly greater than VIP-inputs (1.4 ± 1.9%). For higher-order basal branches, all input sources were significantly different (PV = 17.3 ± 1.4%, n = 7 cells, N = 4 animals; SST = 10.2 ± 1.4%, n = 7 cells, N = 4 animals; VIP = 2.3 ± 1.4%, n = 7 cells, N = 2 animals). Two-way RM ANOVABinned-Input: F(2,18) = 47.3, p < 0.0001.

