Figure 9.
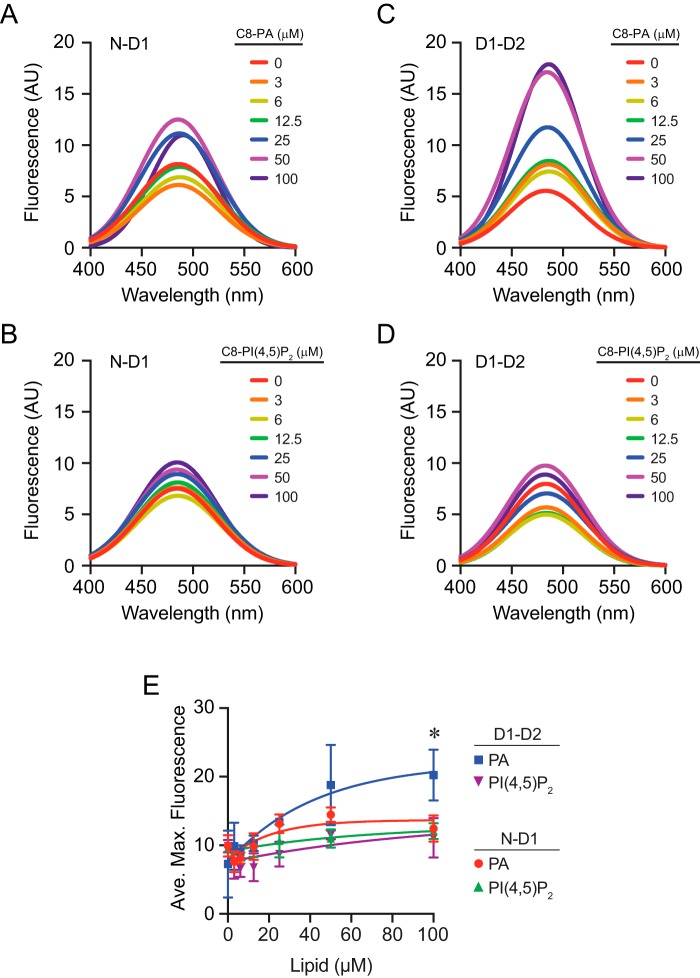
ANS fluorescence of Sec18 domains bound to lipids. N-D1 (0.5 μm) was incubated with dosage curves of C8-PA (A) or C8-PI(4,5)P2 (B) and 5 μm ANS. Fluorescence was measured by exciting at 390 nm and scanning a range of emission wavelengths. C and D, D1–D2 (0.5 μm) was incubated with C8-PA or C8-PI(4,5)P2 and 5 μm ANS. Fluorescence was detected as above. E, quantitation of maximum fluorescence measurements at each concentration of lipid. Error bars represent S.E. (n = 3). *, p < 0.05.

