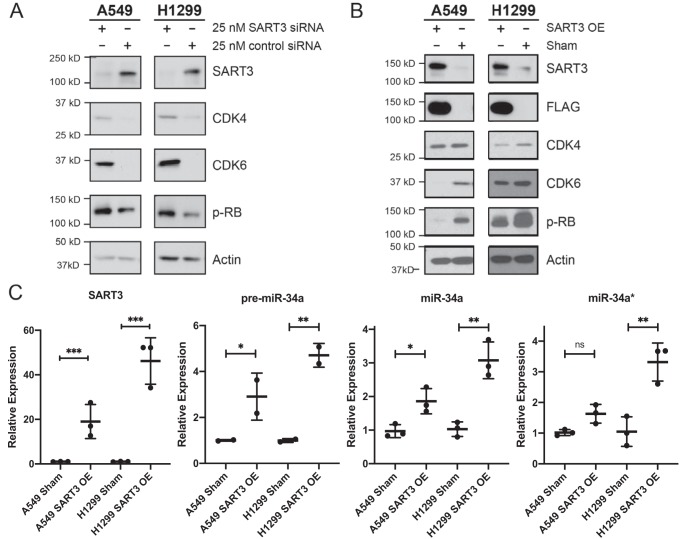
Figure 3.
SART3 levels influence CDK4/CDK6 expression and miR-34a levels. A, SART3 knockdown results in up-regulation of CDK4, CDK6, and phospho-RB (p-RB). B, stable overexpression of 1×FLAG-SART3 results in decreased CDK4, CDK6, and phospho-RB. C, SART3 mRNA, pre-miR-34a, miR-34a, and miR-34a* levels as determined by qRT-PCR. SART3 was normalized to UBB, and miRNAs were normalized to U6 snRNA (n = 2 for pre-miR-34a, n = 3 for all others). Two-tailed Student's t test was applied. *, p ≤ 0.05; **, p ≤ 0.01; ***, p ≤ 0.001; ns, not significant. Error bars, S.D.

