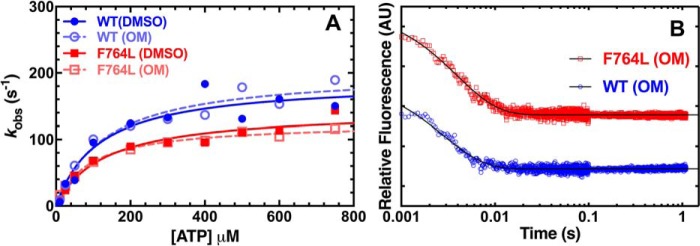
Figure 7.
ADP release from acto-myosin. A, the ADP release rate constant was examined by mixing pyrene actomyosin·ADP (0.225 μm M2β-S1 and pyrene actin, 50 μm ADP) with varying ATP concentrations (10 to 750 μm) in the presence of 0.1% DMSO or 10 μm OM. Fluorescent transients were fit to a single exponential function. The rate constants were fit to hyperbolic function (kobs = k+D′/(1 + Kapp/[ATP])) to determine the ADP release rate constant (k+D′). B, the ADP release rate constant was also examined with mant-labeled ADP by mixing a complex of 0.5 μm M2β-S1, 1 μm actin, and 10 μm mant-ADP with 1 mm ATP. Representative fluorescence transients of mant-ADP release from actomyosin (average of 5 transients) fit to a single exponential function are shown (rate constant and amplitude at each condition; WT DMSO, k = 347.4 ± 7.6 s−1, A = 0.38; WT OM, k = 348.9 ± 6.1 s−1, A = 0.45; F764L DMSO, k = 232.1 ± 3.2 s−1, A = 0.51; F764L OM, k = 251.6 ± 3.0 s−1, A = 0.53).

