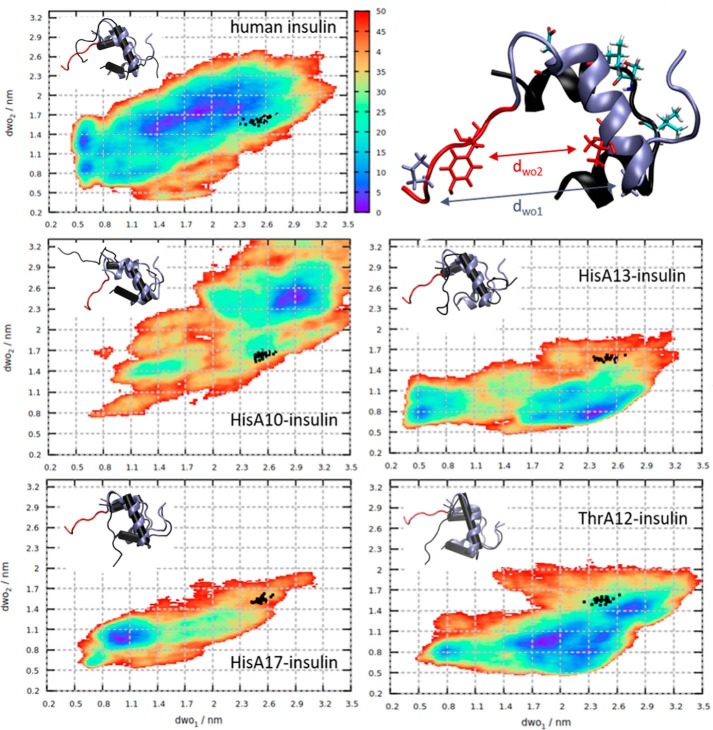
Figure 4.
Free energy profiles (color scale in kJ/mol) of human insulin and analogs obtained from metadynamics. Black dots represent insulin conformations from molecular dynamics simulations in complex with IR. The B-chain of representative minimal energy conformers of insulin mutants (in black) aligned to the IR-bound conformation of human insulin (ice blue, C terminus in red) are depicted in the insets. The IR-bound conformation of human insulin is shown on the upper right, with residues defining the dwo1 (Gly-B8–Pro-B28) and dwo2 (Val-B12–Tyr-B26) distances, represented as ice blue and red licorice, respectively. The A-chain is in black, with the mutated residues (Ile-A10, Ser-A12, Leu-A13, Glu-A17) shown as licorice and colored by atom type.

