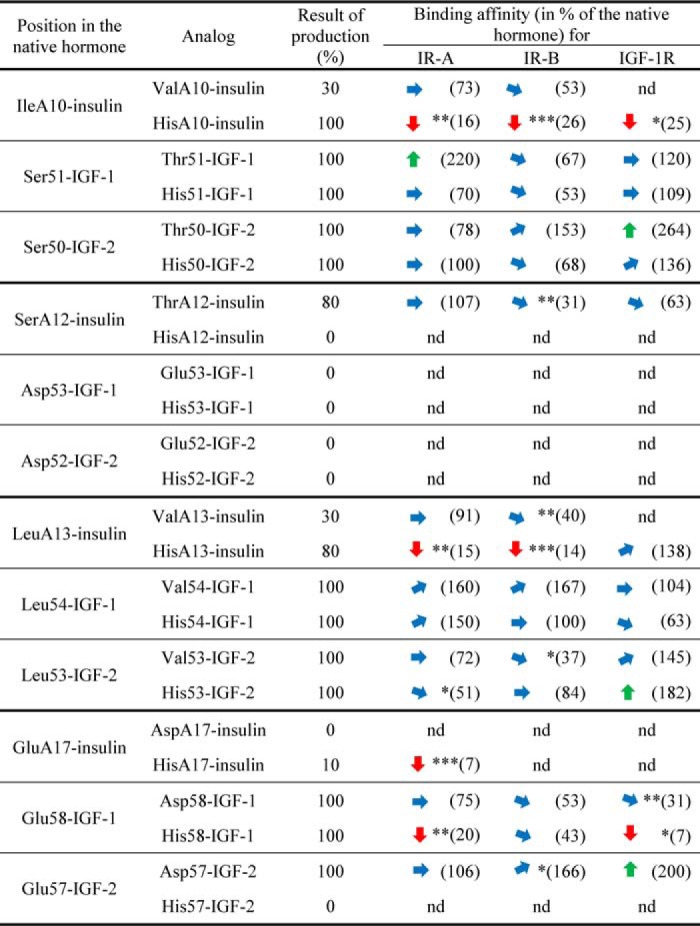
Table 1.
Simplified overview of relative receptor-binding affinities of insulin, IGF-1, and IGF-2 analogs
The relative binding affinities are shown in % of the native hormone, which has 100% binding affinity for the specific receptor (i.e. insulin analogs are related to human insulin, IGF-1 analogs are related to IGF-1, etc.). The approximate major trends in binding affinities of the analogs are indicated by arrows: the upward greeen arrow means >170%, upward diagonal blue arrow means 170–130%, sideways blue arrow means 130–70%, downward diagonal blue arrow 70–30%, and downward red arrow <30% of binding affinity of the native hormone (100%). Numbers in parentheses show mean Kd values, nd is not determined. Asterisks indicate that binding of the ligand to the receptor by the ligand differs significantly from that of the native hormone. *, p < 0.05; **, p < 0.01; ***, p < 0.001. Details are provided in Tables S1–S3. The results of production are related (in %) to native hormones. The typical approximate yield for standard chemical synthesis of insulin (starting with 100 μmol of resin) was ∼ 1 mg. The typical yield for IGF-1 or IGF-2 production from 1 liter of medium was ∼ 0.4 or 0.3 mg, respectively.

