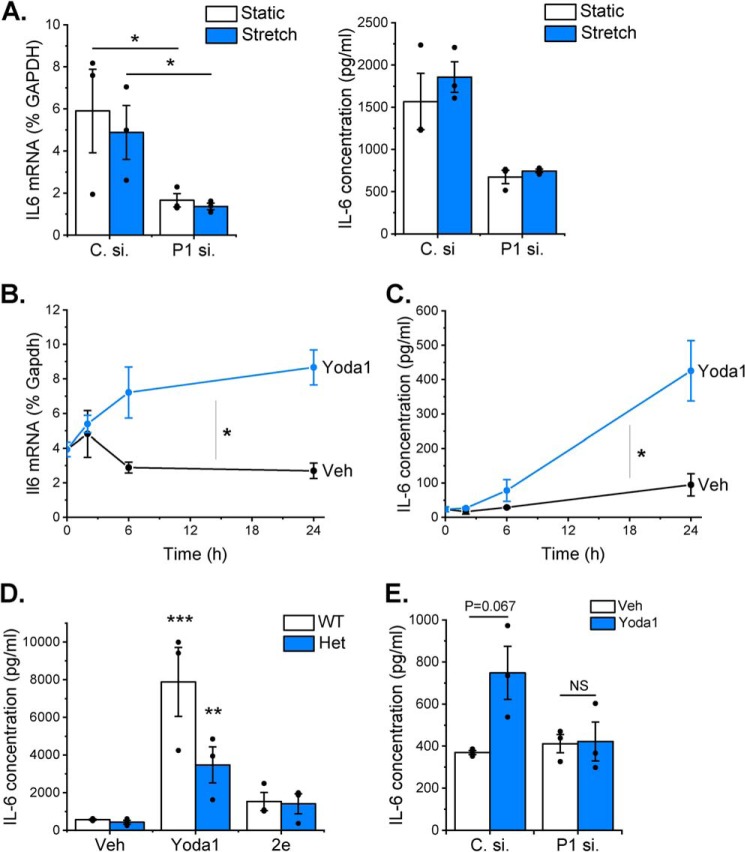
Figure 5.
Activation of Piezo1 is coupled to IL-6 expression. A, RT-PCR analysis of IL6 mRNA expression (left panel) and ELISA analysis of IL-6 protein secretion (right panel) after exposure of human cardiac fibroblasts to 24-h cyclical stretch (1 Hz, 10% stretch) on collagen-coated BioFlex plates compared with fibroblasts maintained in parallel under static conditions. Cardiac fibroblasts were transfected previously with either control siRNA (C. si.) or Piezo1-specific siRNA (P1 si.). RT-PCR data are expressed as percent of the housekeeping control GAPDH. Repeated measures two-way ANOVA for RT-PCR (n = 3): p = 0.0704, F = 12.7 (siRNA); p = 0.403, F = 1.1 (stretch); p = 0.754, F = 0.13 (interaction). Post hoc test: *, p < 0.05. Repeated measures two-way ANOVA for ELISA (n = 3): p = 0.0268, F = 35.8 (siRNA); p = 0.1545, F = 5.0 (stretch); p = 0.838, F = 0.05 (interaction). Post hoc test: not statistically significant. B and C, murine cardiac fibroblasts were exposed to vehicle (Veh) or 10 μm Yoda1 for 2–24 h before measuring Il6 mRNA levels by RT-PCR, where expression is measured as percent of the housekeeping control Gapdh (B) or analyzing conditioned medium for IL-6 levels by ELISA (C) (both n = 3). Comparison of the area under the curve by paired t test: *, p < 0.05 for the effect of Yoda1 on IL-6 expression at both mRNA and protein levels. D, cardiac fibroblasts from WT (n = 4) and Piezo1+/− (Het, n = 3) mice were treated with vehicle, 10 μm Yoda1, or compound 2e for 24 h before measuring IL-6 levels in conditioned medium using ELISA. Two-way ANOVA: p < 0.0001, F = 24.9 (compound); p = 0.1041, F = 3.1 (genotype); p = 0.615, F = 0.51 (interaction). Post hoc test: ***, p < 0.001; **, p < 0.01 for the effect of Yoda1 versus vehicle. All other changes were not statistically significant. E, mouse cardiac fibroblasts were transfected with control or Piezo1-specific siRNA and treated with either vehicle or 10 μm Yoda1 for 24 h before collecting conditioned media and measuring IL-6 levels by ELISA (n = 3). Repeated measures two-way ANOVA: p = 0.2349, F = 2.82 (siRNA); p = 0.2187, F = 3.13 (Yoda1); p = 0.064, F = 14.2 (interaction). Post hoc test: NS, not significant versus vehicle-treated cells.

