
Figure 3.
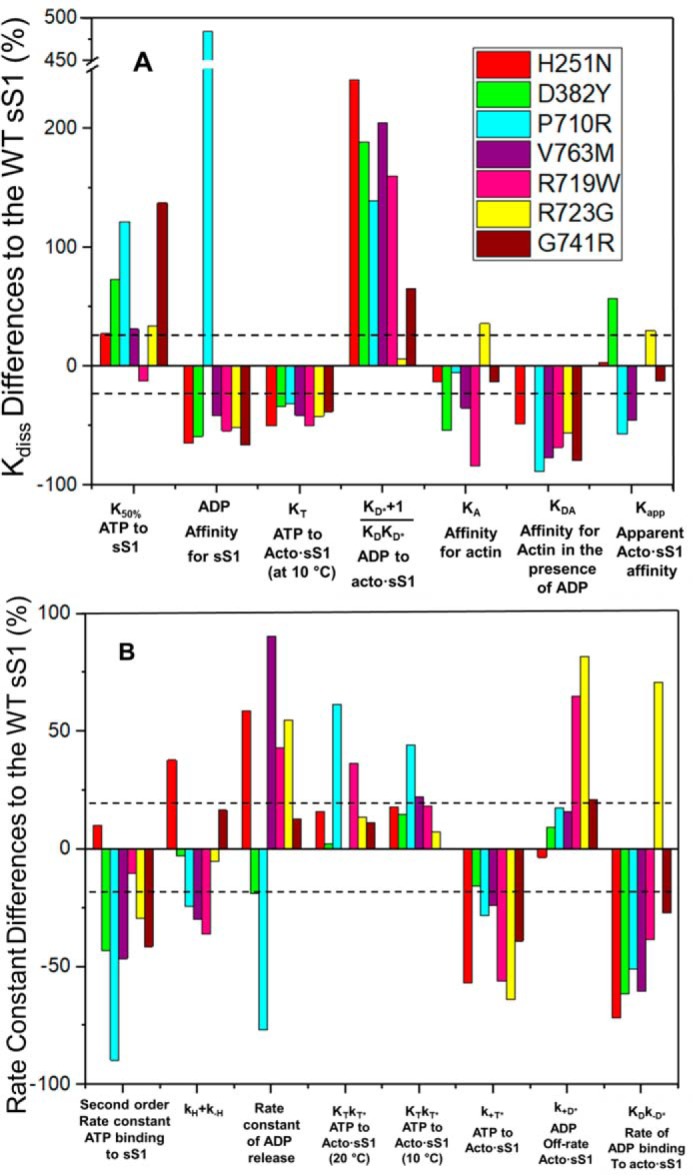
Summary of percentage differences in kinetic parameters of HCM mutations relative to WT. A, % change for measured dissociation or equilibrium constants. Also included is the Kapp value from ATPase analysis. B, % change of several measured rate constants. Color-coded to match the parameter to each HCM mutation. The dashed lines represent ±20% change in the parameter considered to be the precision of each measurement.