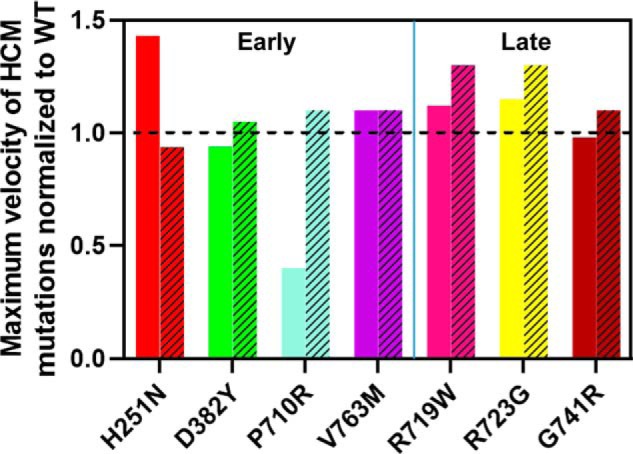
Figure 6.

Comparison of normalized in vitro motility values to the predicted velocity of shortening. The solid coloring depicts the top 5% mean velocity values measured experimentally through unloaded in vitro motility. The bars with hatched patterns are the values predicted for the kinetic model analysis as described (27). The dashed line indicates the normalized WT value of 1 for comparing the mutations.
