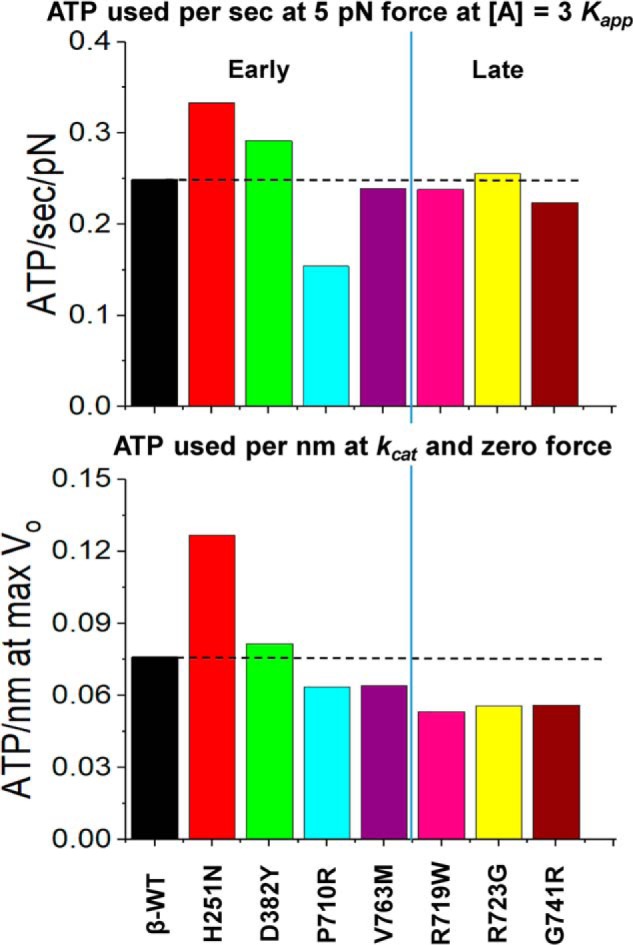
Figure 7.

Economy of force generation and velocity for HCM mutations. Top, ATP usage per second per pN of force while generating 5 pN of force at [A] = 3Kapp. Bottom, ATP used per second at maximum shortening velocity (zero load). Because ATPase and DR have the same dependence on [A], this calculation is the same at all actin concentrations except very low values where the motor cannot maintain constant velocity.
