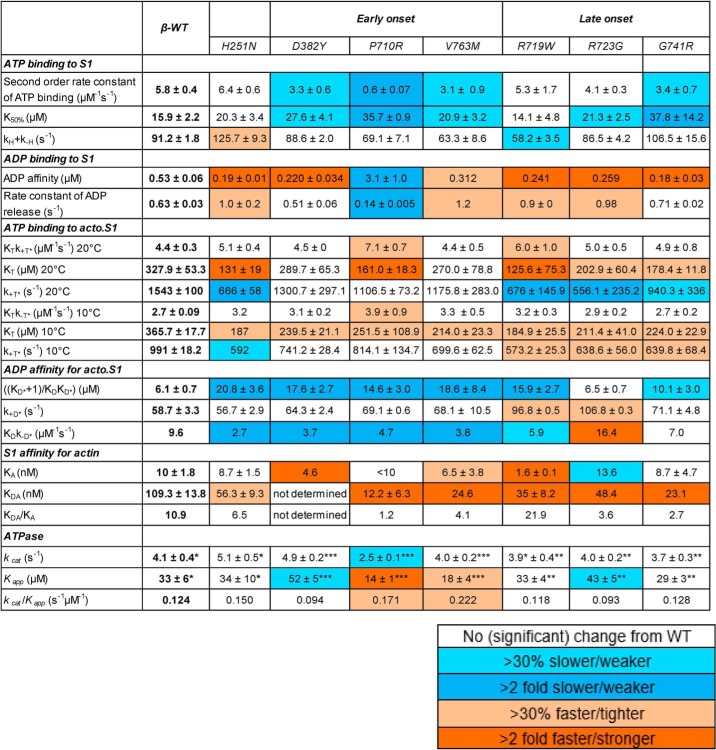
Table 1.
Kinetic parameters for β-WT and 8 HCM mutations
The color code described in the smaller table indicates degree of difference from WT. Experimental conditions for stopped-flow: 25 mm KCl, 5 mm MgCl2, 20 mm MOPS, pH 7.0, 20 °C. Data are the mean ± S.E. values from 3–5 independent measurements with 4–6 technical replicates. Values without S.E. are either ratios calculated with other values or parameters with one measurement. Bottom of the table contains the ATPase values used for modeling: *ATPase values from (17), **ATPase values from (15), ***Unpublished ATPase values.

