Figure 2.
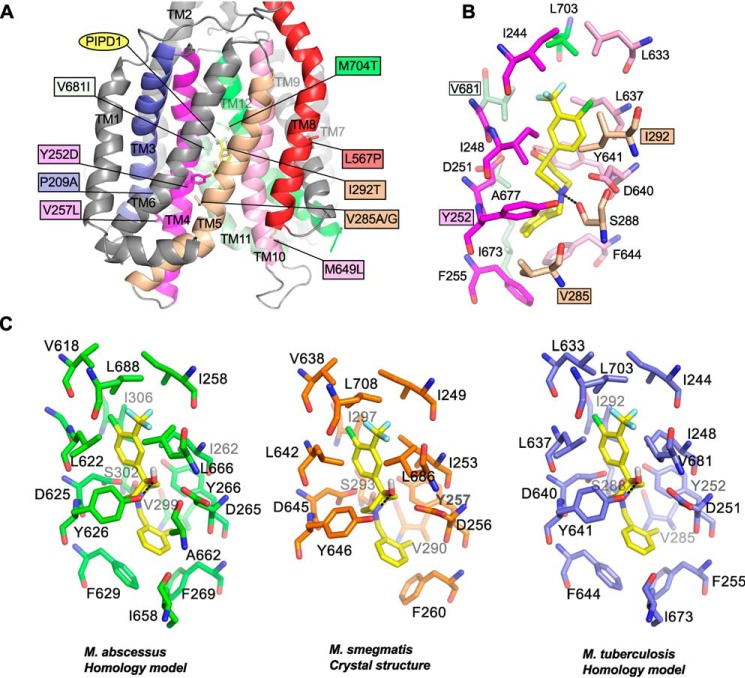
Localization of mutations conferring resistance to PIPD1 on a M. tuberculosis MmpL3 predictive structural model. A, mapping of the various mutations identified in spontaneous resistors selected against PIPD1 on a M. tuberculosis MmpL3 three-dimensional homology model. Only the transmembrane helices are depicted. The mutated residues are shown as sticks, and the mutations are indicated in the colored boxes. All the TM helices are in gray, excepting those carrying mutations, notably TM3 (blue), TM4 (magenta), TM5 (wheat), TM8 (red), TM10 (pink), TM11 (pale green), and TM12 (green). PIPD1 is shown as yellow sticks. B, the figure depicts the residues forming the proposed PIPD1-binding cavity. Residues are in the same color code as in A. The four residues interacting with PIPD1 and found mutated in the PIPD1 resistant strains are in indicated in colored boxes. PIPD1 was docked in the model and the best docking pose is represented and corresponds to a binding energy of ΔG° = −7.6 kcal/mol. The black dashed lines indicate hydrogen bonds. C, comparison of the PIPD1-binding sites in MmpL3 from M. abscessus (green), M. smegmatis (orange), and M. tuberculosis (blue).

