Figure 3.
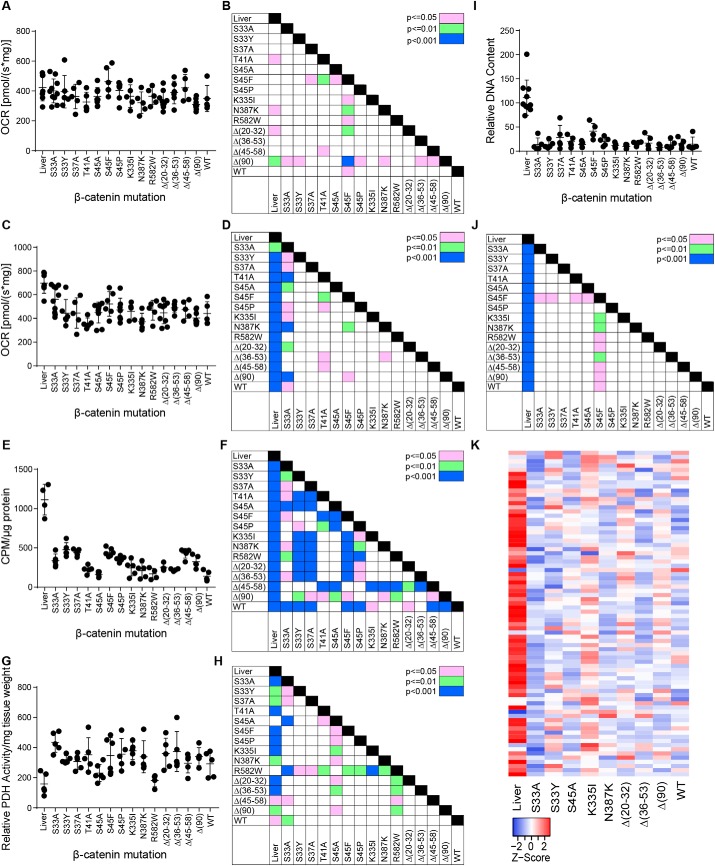
Metabolic behavior of HBs driven by different β-catenin mutants. A, Complex I activity. OCRs were determined on tissue homogenates following the addition of pyruvate, malate, glutamate, and ADP (20, 24, 25, 46, 49, 50). B, significant pair-wise comparisons between individual tumors groups based on the results shown in A. C, Complex II activity. Following the addition of succinate to achieve the maximal combined activities of Complexes I + II, rotenone was added to inhibit Complex I. The residual activity (i.e. that of Complex II) is shown here. D, significant pair-wise comparisons between individual tumor groups based on the results shown in C. E, FAO activity in the indicated tissues. F, significant pair-wise comparisons between individual tumors groups based on the results shown in E. G, PDH activity in the indicated tissues. H, significant pair-wise comparisons between individual tumors groups based on the results shown in G. I, mtDNA quantification. A TaqMan assay was used to amplify a region of the mitochondrial D-loop region as described previously (24, 50). Results were normalized to an amplicon from the nuclear gene encoding apolipoprotein B. J, significant pair-wise comparisons between individual tumors groups based on the results shown in I. K, transcript levels of mitochondrial ribosomal protein subunits. The indicated liver and tumor tissues (five per group) were subjected to RNA-Seq analysis. Levels of 78 transcripts encoding each of the mitochondrial ribosomal protein subunits are expressed as mean values and depicted as Z-scores. Error bars, S.E.

