Figure 4.
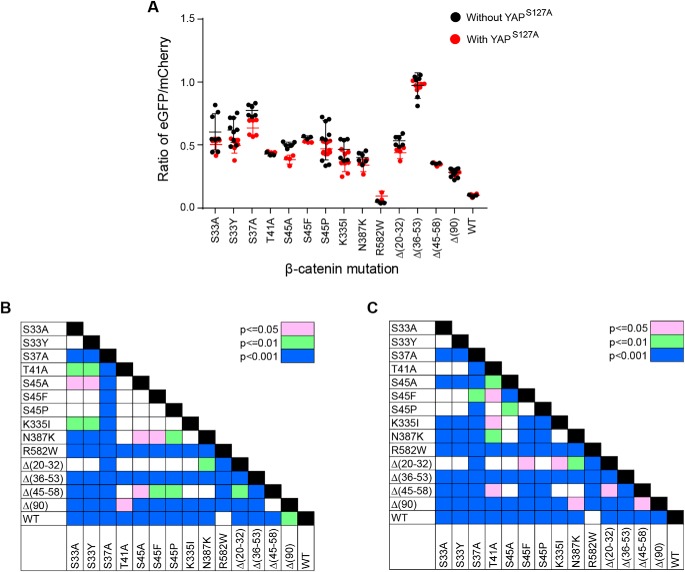
Transactivation potential of different β-catenin mutants. A, eGFP/mCherry ratios in response to the co-expression of each of the indicated β-catenin mutants and in the absence (black circles) or presence (red circles) of co-expressed YAPS127A. Each point represents the results of a single transfection and the evaluation of at least 10,000 mCherry-positive cells. At least three transfections for each mutant were performed on different days. B, significant pair-wise comparisons between transfections without YAPS127A shown in A. C, significant pair-wise comparisons between transfections performed in the presence of co-expressed YAPS127A shown in A. Error bars, S.E.

