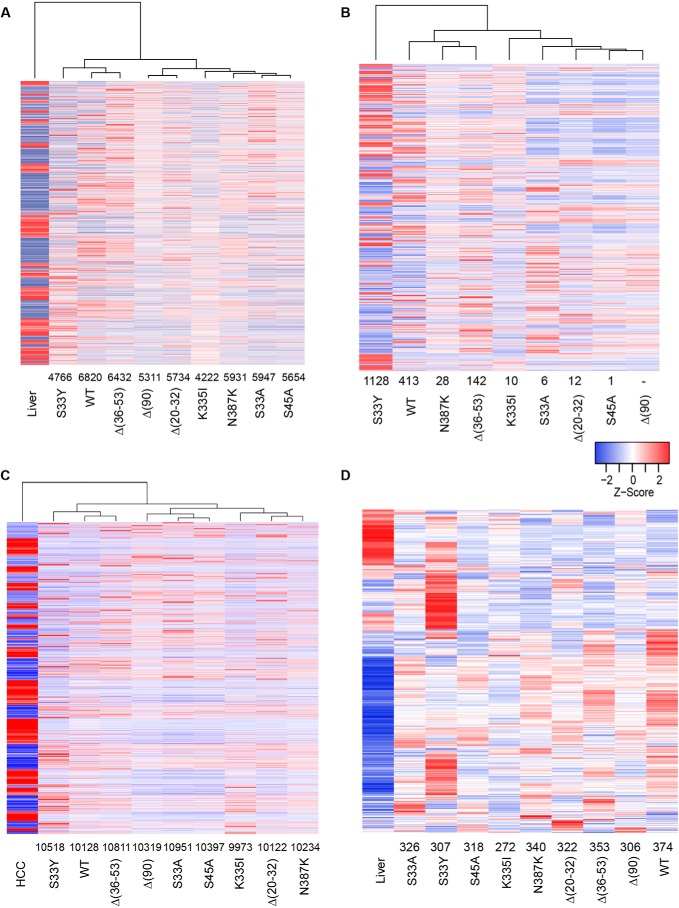
Figure 5.
Transcriptomic differences among select HBs. A, gene expression differences among select β-catenin–induced tumors and normal control livers. Each column represents the mean transcript expression level of five tissue samples from that cohort. Gene expression differences were identified from RNA-Seq data using CLC Genomic Workbench (Qiagen), DeSeq2, and EdgeR, and only those transcripts identified by all three methods as being differentially expressed are included. The number above each tumor cohort indicates the differentially expressed transcript differences between that group and normal liver (also see Table S3). The mean number of differences among all groups was 5646. B, gene expression differences among each of the individual cohorts. Numbers above each tumor group indicate the number of gene expression differences compared with the Δ(90) cohort. See Table S2 for a comparison of gene expression differences among all cohort comparisons. C, gene expression differences between each cohort of β-catenin–induced tumors and HCCs. The latter were induced by induction of a doxycycline-regulated human Myc transgene as described previously (50). Numbers below each cohort indicate the number of gene expression differences relative to the HCC group. This along with principle component analysis (PCA; supporting Fig. S3) indicated that, despite their histologic differences, all β-catenin–induced tumors were much more HB-like than HCC-like at the molecular level and more closely resembled liver than they did HCC (Fig. S3). D, HBs deregulate a majority of genes identified as direct and expressed targets of β-catenin/Tcf4. Transcripts in the “liver” cohort include the entire 613 repertoire of expressed genes from normal liver whose proximal promoters were bound by β-catenin/Tcf4 (30). Numbers below the tumor cohorts indicate the number of transcripts that were deregulated relative to those in the liver. See Table S3 for a pairwise comparison of Myc target gene differences among all cohorts.

