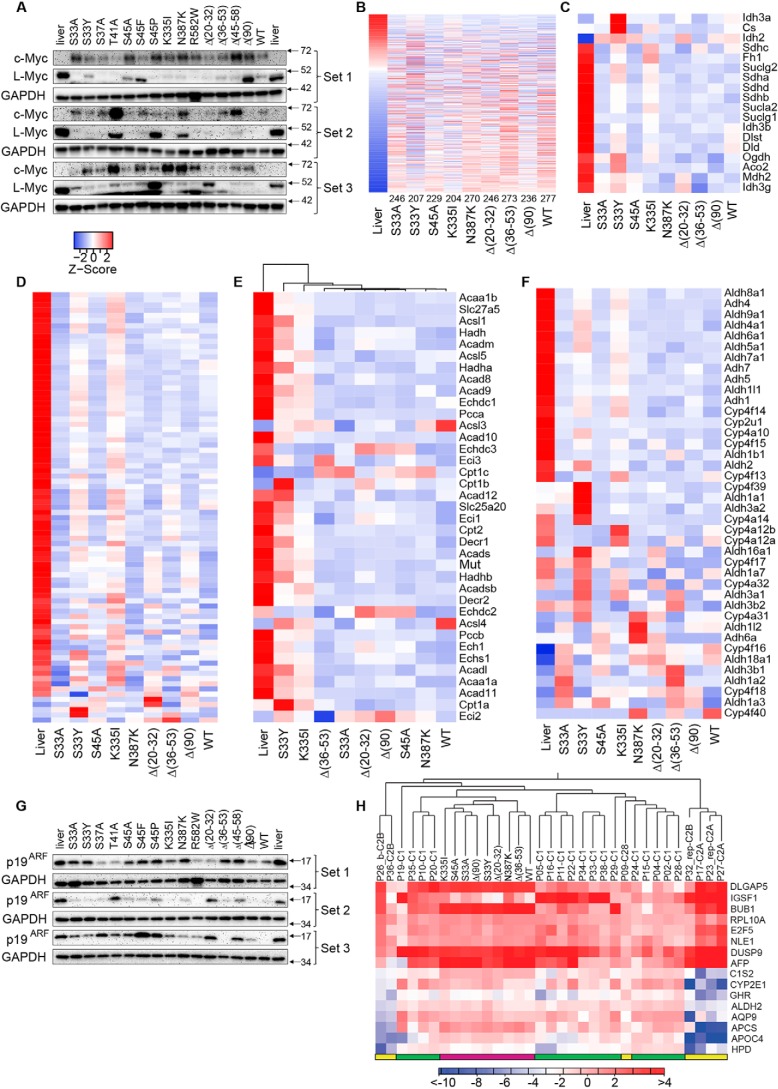
Figure 6.
Regulation of metabolic pathways is β-catenin mutant–specific. A, c-Myc and l-Myc protein levels in individual tumors. B, expression of 613 direct Myc target genes previously identified in hepatocytes (53). Transcripts are arranged from highest to lowest expression based on levels in liver. Numbers at the bottom indicate the number of significant expression differences versus liver. Table S3 shows the actual number of differentially regulated transcripts among all pairwise comparisons. C, transcripts encoding TCA cycle enzymes. Table S4 shows the number of similarly regulated transcripts between any two tissues relative to those in liver. D, transcripts encoding ETC and Complex V subunits. Table S5 shows the number of transcript differences among all pairwise comparisons. E, differential regulation of transcripts encoding mitochondrial FAO-related transcripts. Table S6 shows the number of transcript differences among all pairwise comparisons. F, differential regulation of (endosomal) FAO (β-oxidation)-related transcripts. Table S7 shows the number of transcript differences among all pairwise comparisons. G, expression of p19ARF in liver and tumor samples. H, murine HBs most closely resemble the C1 molecular subtype of human HBs. The CLC Genomics Workbench hierarchical clustering program was used to compare and organize the murine orthologs of the 16-transcript set of Cairo et al. (48) with the RNA-Seq data from Hooks et al. (19). Human tumor results are from individual tumors, whereas murine results represent the mean expression value of five tumors for each group as done for other panels in the figure. Human C1 tumors are indicated by the green bars at the bottom of the heat map, human C2A and B tumors are indicated by the yellow bars, and murine tumors are indicated by magenta bars. The scale bar here indicates the -fold change rather than the Z-score.

