Figure 3.

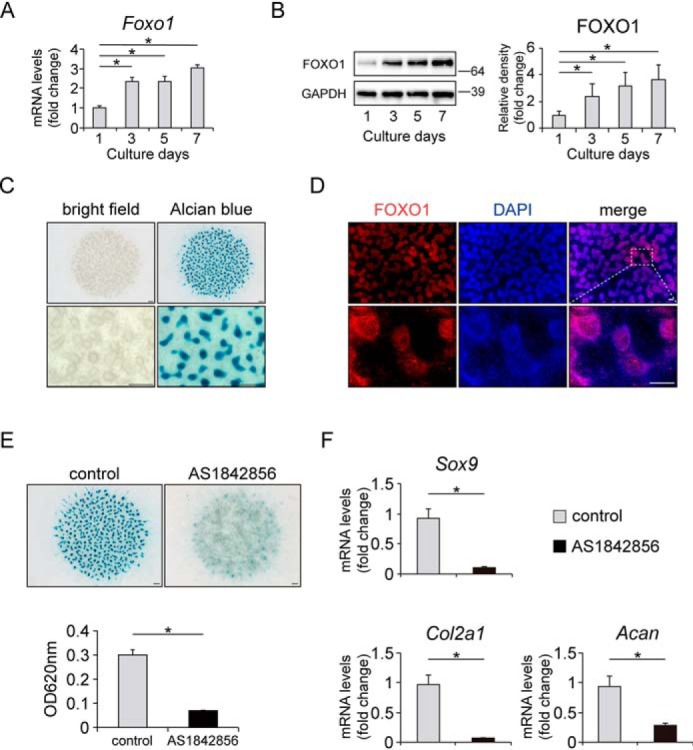
FOXO1 regulates chondrogenic differentiation in mesenchymal cells from mouse limb buds. A, time course of Foxo1 expression in micromass cultures of E11.5 mouse limb bud mesenchymal cells incubated for 1 week, as determined by qRT-PCR. Gene expression at each stage is shown relative to the level on day 1; n = 4. B, levels of FOXO1 protein in micromass cultures incubated for 1 week, as determined by Western blotting. The graph shows FOXO1 protein level relative to the level on day 1; n = 4. C, representative images of micromass cultures on day 5 before (left) and after (right) Alcian blue staining. Bottom images show higher magnification views of the top images. Bars represent 300 μm. D, FOXO1 localization was visualized by immunocytochemistry using anti-FOXO1 antibody and Alexa Fluor 568-conjugated secondary antibody (red staining). Nuclei were detected with DAPI (blue staining). Bottom images show higher magnification views corresponding to the boxed areas in the top images. Bars represent 150 μm. E, Alcian blue staining images of micromass cultures incubated with or without AS1842856 (0.1 μm) for 5 days. The graph below shows measurements of Alcian blue staining at 620 nm. Bars represent 300 μm; n = 4. F, micromass cultures were incubated with or without AS1842856 (0.1 μm) for 5 days. Relative mRNA levels of Sox9, Col2a1, and Acan were measured by qRT-PCR. Gene expression is given relative to the level in cultures incubated without AS1842856; n = 4. Data are presented as mean ± S.D. Statistical analysis in A and B was performed using one-way repeated measures ANOVA with the Tukey-Kramer post hoc test. Statistical analysis in E and F was performed using Wilcoxon's rank-sum test. *, p < 0.05.
