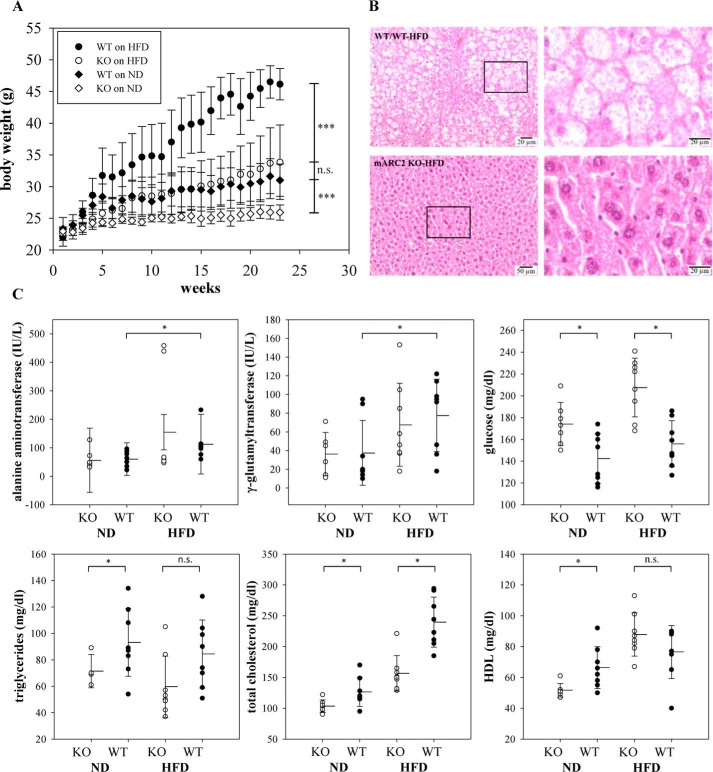
Figure 2.
MARC2 KO mice are resistant to HFD-induced obesity. A, mean body weights of mice in each treatment group throughout a period of 23 weeks. Two groups (WT and MARC2 KO) were fed an ND (10% of calories from fat), and the other two (WT and MARC2 KO) were fed an HFD (60% of calories from fat). Differences were tested at the end of the experiment with a U test (n = 8). Whiskers indicate S.D. B, representative liver histology of WT and MARC2 KO mice on the HFD at the end of the 23-weeks experiment, stained with hematoxylin and eosin (magnification, ×200). C, serum biochemical readouts. The differences in pairwise comparisons were tested with a t test (n = 8). *, p < 0.05; ***, p < 0.001; n.s., not significant.

