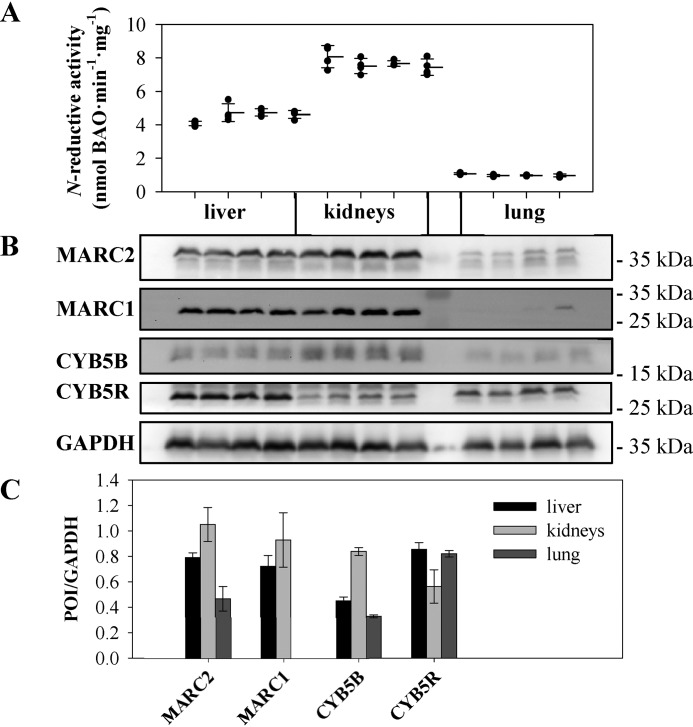
Figure 4.
Correlation of reductase activity and protein expression. A, N-reductive activity was determined by reduction of BAO in multiple incubations (N ≥ 4) of different tissue homogenates of four individual WT mice over a time period of 20 min. B, homogenates were examined via Western blot analysis. C, expression levels of POI were measured and normalized to the loading control (GAPDH) per lane. Validation of the GAPDH signal for normalization and full original western blots are shown in Figs. S1 and S7.

