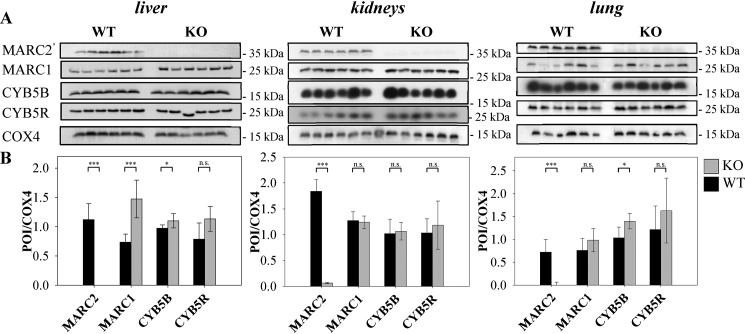
Figure 5.
Protein expression of tissues from KO and WT mice. A, protein expression of six individual MARC2 KO mice and six individual WT mice was examined immunologically by SDS-PAGE and subsequent Western blot analysis. Representative COX4 loading control lanes are shown (for details, see Figs. S3–S6). B, quantification of expression levels. The ration of POI signal to loading control signal was calculated per lane. Validation of the COX4 signal for normalization and full original western blots are shown in Figs. S2–S6. Significance was proven by t and U test. *, p < 0.05; ***, p < 0.001; n.s., not significant.

