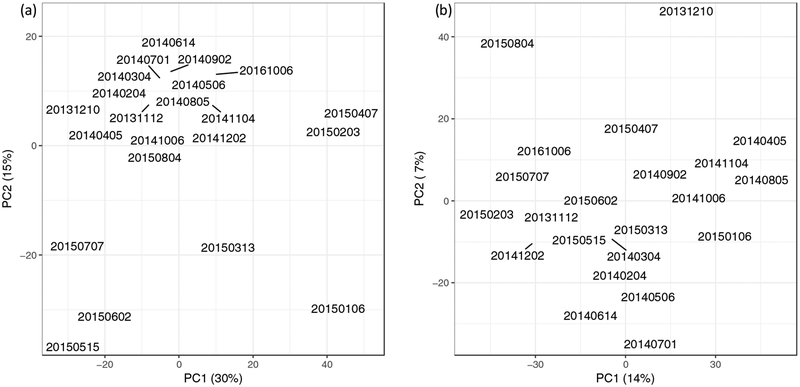
Figure 2. Principal component analysis (PCA) of bacterial signals.
For both ensembles, there are data for 22 time points. (a) The Competibacter-positive probe ensemble. The 95% confidence intervals of the first and second principal components are marked by the gray box. The samples from January to July of 2015 fall outside the box. (b) The Competibacter-negative probe ensemble. The 95% confidence intervals of the first and second principal components are marked by the gray box. Two samples fall just outside the gray box. These fall within the box when the data for the toxin genes are not included in the analysis.

