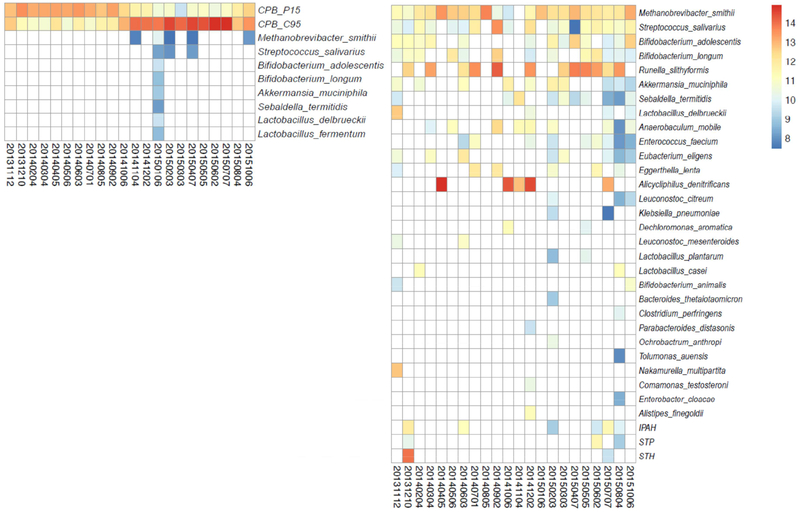
Figure 3.
Heatmap of bacterial signal for those bacteria detected more than once over the time course. For each bacterium, the probe-level signal was normalized and log2-transformed (counts per million), then averaged to represent the bacterium signal as indicated by the color gradient within the heatmaps: red, high signal; yellow, middle signal; blue, low signal. Each row shows the time course of one bacterium, with the strength of the signal represented by different colors. 4a, Competibacter -positive probe ensemble; 4b, Competibacter -negative probe ensemble)

