Fig. 5.
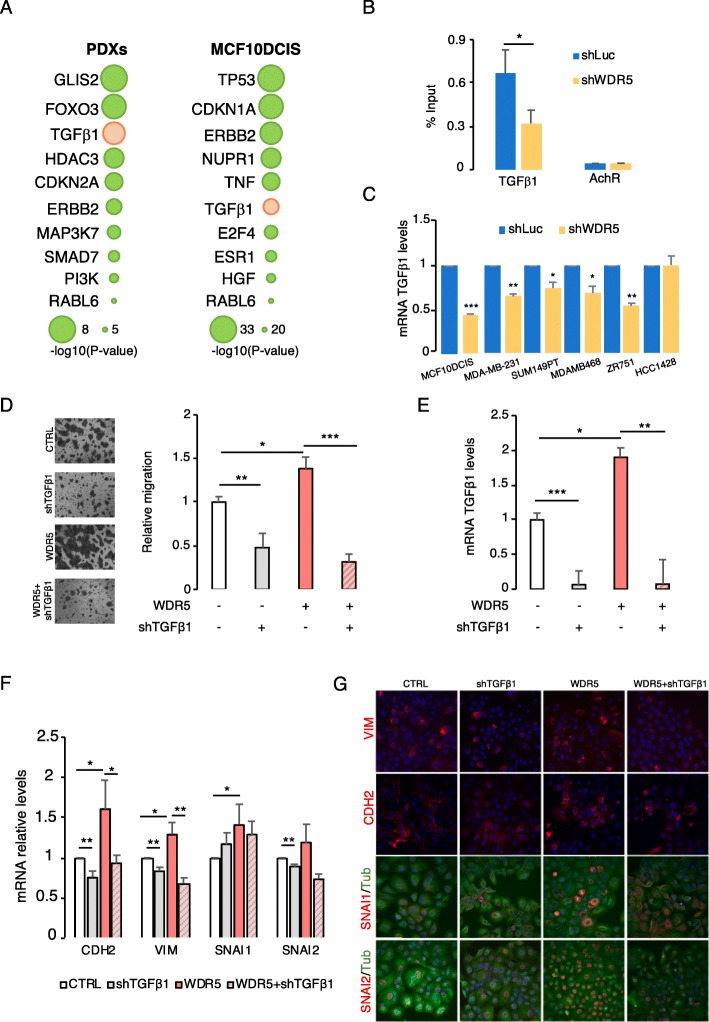
WDR5 regulates TGFβ1 in breast cancer. a Ingenuity pathway analysis was used for upstream pathway evaluation. Representative regulators of DEGs in PDXs and MCF10DCIS are shown. For complete list, refer to Supplementary Table S3. TGFβ1 is reported as one of the most significative upstream regulators in all samples. b Quantitative chromatin immunoprecipitation (qChIP) was used to analyze binding of WDR5 to TGFβ1 promoter in MCF10DCIS cells. qChIP was performed on shLuc and shWDR5 cells and values expressed as percentage of input chromatin (mean ± SD; n = 2; *P < 0.05). c RT-PCR was performed to evaluate TGFβ1 mRNA level reduction upon WDR5 silencing in MCF10DCIS, MDA-MB-231, and other BC cell lines (2 TN—SUM149PT and MDAMB468—and 2 LB—ZR751 and HCC1428). Statistical significance among shLuc and shWDR5 groups was calculated by applying a Student t test (*P < 0.05; **P < 0.01; ***P < 0.001). d–g MCF10DCIS cells were infected to silence TGFβ1 (shTGFβ1) in presence (+) or absence (−) of WDR5 overexpression. d Relative migration was evaluated in the indicated conditions and representative images reported. Statistical significance among groups was calculated by applying one-way ANOVA followed by the Bonferroni post test (*P < 0.05; **P < 0.01; ***P < 0.001). e TGFβ1 mRNA levels were evaluated by RT-PCR in presence (+) or absence (−) of WDR5 overexpression. Statistical significance among groups was calculated by applying an unpaired Student t test (*P < 0.05; **P < 0.01; ***P < 0.001). f, g EMT markers were evaluated by RT-PCR (f) and immunofluorescence (IF) techniques (g) in the indicated conditions. Statistical significance among groups was calculated by applying an unpaired Student t test (*P < 0.05; **P < 0.01). Nuclei are stained in blue (DAPI), cell morphology assessed by tubulin staining (in green), VIM, CDH2, SNAI1, and SNAI2 are labeled in red (× 40 magnification)

