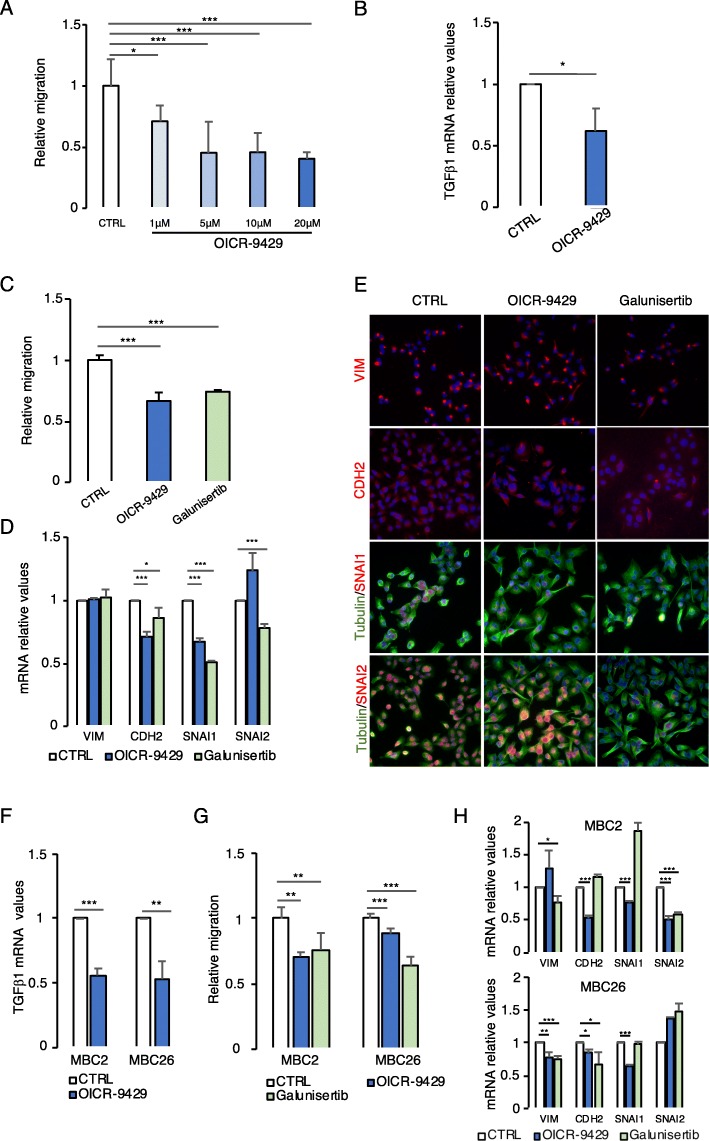
Fig. 6.
WDR5-TGFβ1 inhibition reduces cell migration and EMT gene expression in breast cancer. a Effect of WDR5 inhibitor OICR-9429 at increasing concentrations (1 μM, 5 μM, 10 μM, 20 μM, 3 days of treatment) was evaluated in MDA-MB-231 cell line. Cells were plated on transwells to test in vitro cell migration, stained with crystal violet, and quantified using ImageJ analysis. Histograms represent relative cell migration expressed as mean ± SD of a biological triplicate. Differences among groups were calculated by applying one-way ANOVA and Dunnett post test (*P < 0.05; ***P < 0.001). b TGFβ1 mRNA levels (mean ± SD of n = 3 experiments) were evaluated by RT-PCR upon OICR-9429 treatment (20 μM) in MDA-MB-231 cells. Statistical differences were calculated by applying a Student t test (*P < 0.05). c MDA-MB-231 cells were treated with OICR-9429 (20 μM) and galunisertib (10 μM—TGFβ1 inhibitor) for 3 days and cells were plated on transwells for the evaluation of in vitro cell migration. Differences among groups were evaluated by applying one-way ANOVA and Dunnett post test (***P < 0.001). d, e VIM, CDH2, SNAI1, and SNAI2 expression was evaluated by RT-PCR (d) and immunofluorescence (e) upon OICR-9429 (20 μM) and galunisertib (10 μM) treatments. Differences in mRNA levels among groups were evaluated by applying an unpaired Student t test (*P < 0.05; ***P < 0.001). For immunofluorescence, DAPI (in blue) was used for nuclei staining and tubulin (in green) for cell morphology staining. VIM, CDH2, SNAI1, and SNAI2 are labeled in red. f Effects of OICR-9429 (20 μM) on TGFβ1 mRNA levels were evaluated in one TN (MBC2) and one LB (MBC26) PDXs. Statistical differences among groups were calculated by applying a Student t test (**P < 0.01; ***P < 0.001). g Effects of OICR-9429 (20 μM) and galunisertib (10 μM) were evaluated in terms of in vitro cell migration after 3 days of treatment in MBC2 and MBC26 PDX cells (mean ± SD of n = 3 experiments). Differences among groups were evaluated by applying one-way ANOVA and Dunnett post test (**P < 0.01; ***P < 0.001). h mRNA levels of VIM, CDH2, SNAI1, and SNAI2 were evaluated by RT-PCR due to aforementioned treatments in MBC2 and MBC26 PDX cells. Statistical significances among groups were calculated by applying a Student t test (*P < 0.05; **P < 0.01; ***P < 0.001)

