
Fig. 5.
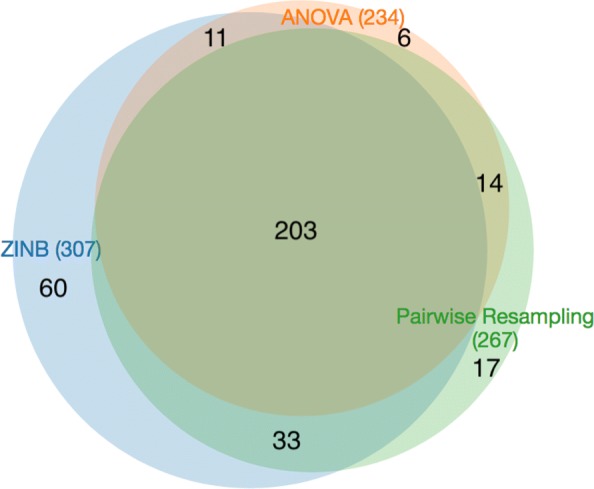
Venn diagram of genes with significant variability in different antibioitic treatments of transposon insertion counts evaluated by three different methods
Official websites use .gov
A
.gov website belongs to an official
government organization in the United States.
Secure .gov websites use HTTPS
A lock (
) or https:// means you've safely
connected to the .gov website. Share sensitive
information only on official, secure websites.
Venn diagram of genes with significant variability in different antibioitic treatments of transposon insertion counts evaluated by three different methods