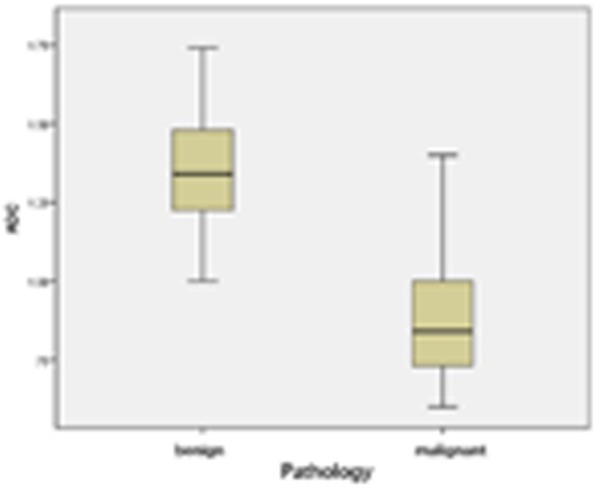
Fig. 1.

Box plot shows apparent diffusion coefficient (ADC) values for malignant and benign thyroid nodules. The bottom, middle, and top box lines indicate the 25th percentile, median, and 75th percentile, respectively. The error bars show the smallest and largest values in 1.5-box lengths of the 25th and 75th percentiles
